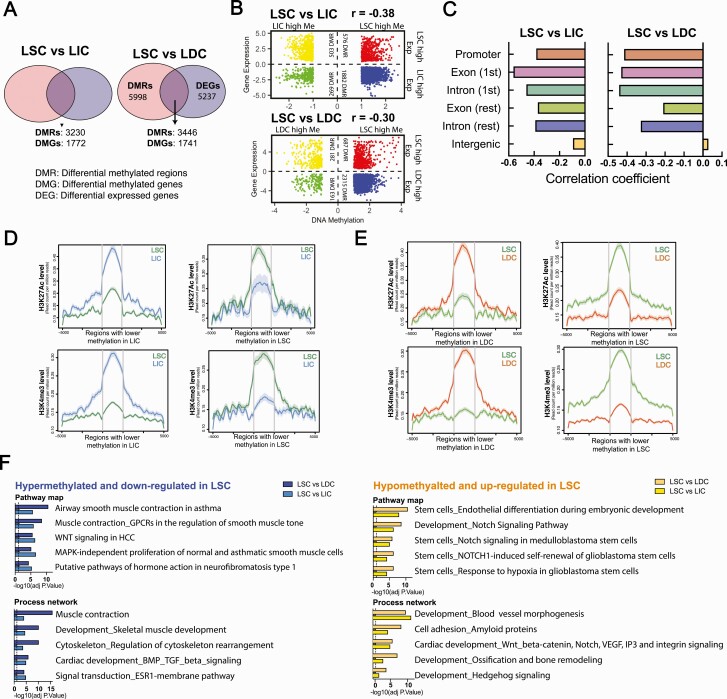
Figure 3.
DNA methylation changes correlate with gene expression changes globally during LSC differentiation. A: Venn diagram showing the overlapping genes between DMGs and DEGs in the LSC versus LIC (left panel) and LSC versus LDC (right panel) comparisons. DMRs were annotated to the closest transcription start site. B: Dot plot showing gene expression and DNA methylation log2 fold-changes in the LSC versus LIC (top panel) and LSC versus LDC (bottom panel) comparisons. Colored dots represent regions associated with significant changes (FDR-adjusted P < 0.05) in both DNA methylation and expression of the nearest gene. Correlation coefficients between log2 fold-changes of gene expression and DNA methylation were calculated for both comparisons. C: Bar graph showing the correlation coefficient between gene expression and DNA methylation log2 fold-changes in the LSC versus LIC (left panel) and LSC versus LDC (right panel) comparisons after stratifying the genomic feature. D: Average line plots show the H3K27Ac and H3K4me3 enrichment level around (±5000 bp) DMRs in LSC versus LIC. E: Average line plots show the H3K27Ac and H3K4me3 enrichment level around (±5000 bp) DMRs in LSC versus LDC. F: Enrichment analysis (Metacore) showing pathways and networks highly enriched in genes that are hypermethylated/downregulated and hypomethylated/upregulated in the LSC compared with LIC or LDC. Abbreviations: DEGs, differentially expressed genes; DMGs, differentially methylated genes; DMRs, differentially methylated regions; DNA, Deoxyribonucleic acid; FDR, False Discovery Rate; LDC, leiomyoma differentiated cells; LIC, leiomyoma intermediate cells; LSC, leiomyoma stem cells.

