Figure 5.
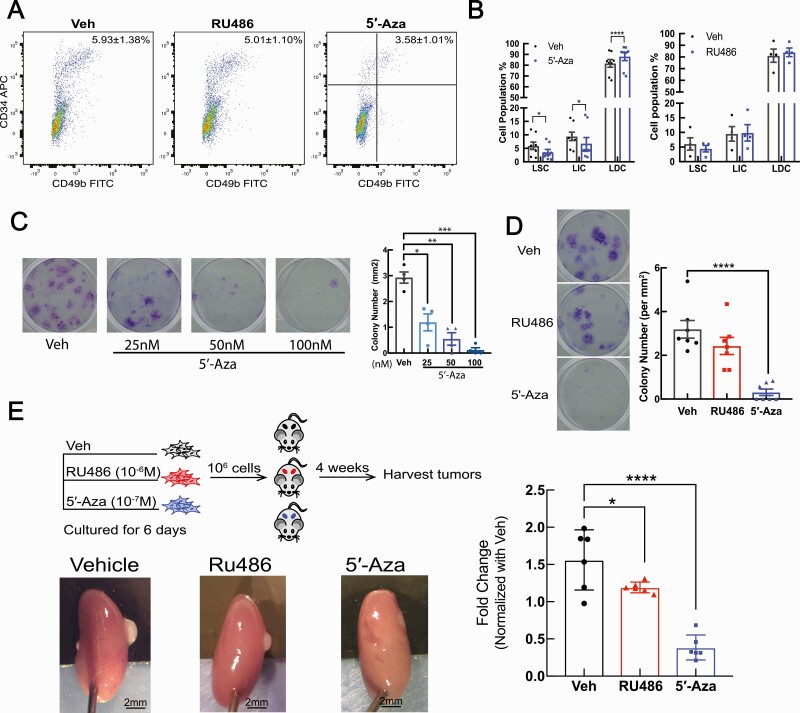
DNA methylation inhibitor 5′-Aza reduces LSC stemness. A: Representative flow cytometry scattergrams showing the LM cell populations isolated from LM tissue explants after a 48-hour incubation with vehicle (DMSO), 5′-Aza (100 nM), or RU486 (1 µM). B: Bar plots quantifying the percentage of each LM cell population in LM explants treated with vehicle, 5′-Aza (100 nM), or RU486 (1 µM; means ± SEM, 5′-Aza = 8 patients, RU486 = 4 patients, *P < 0.05, ****P < 0.0001, two-way ANOVA followed by pairwise comparisons). C: Colony formation assay of LM primary cells pretreated with Vehicle is DMSO (Dimethyl sulfoxide) or 5′-Aza (25 nM, 50 nM, 100 nM) for 6 days. Representative pictures of the colony formation assay (left panel); quantification of clone numbers per mm2 of culture area under each treatment (left panel; means ± SEM, n = 4 patients, *P < 0.05, **P < 0.01, ***P < 0.001, one-way ANOVA followed by pairwise comparisons). D: Colony formation assay of primary LM cells pretreated with vehicle (DMSO), 5′-Aza (100 nM), or RU486 (1 µM) for 6 days. Representative pictures of the colony formation assay (left panel); quantification of clone numbers per mm2 of culture area under each treatment (right panel; means ± SEM, n = 7 patients, ****P < 0.0001, one-way ANOVA followed by pairwise comparisons). E: Workflow of the in vivo xenograft mouse experiments using primary LM cells pretreated with vehicle (DMSO), RU486 (1 µM), or 5′-Aza (100 nM) for 6 days (top-left panel). Representative pictures of regenerated LM tumors (bottom-left panel). Quantification of the tumor volumes (right panel; means ± SEM, patient number = 3, kidney graft = 6, *P < 0.05, ****P < 0.0001, one-way ANOVA). Abbreviations: ANOVA, analysis of variance; DNA, deoxyribonucleic acid; LM, leiomyoma; LSC, leiomyoma stem cells.

