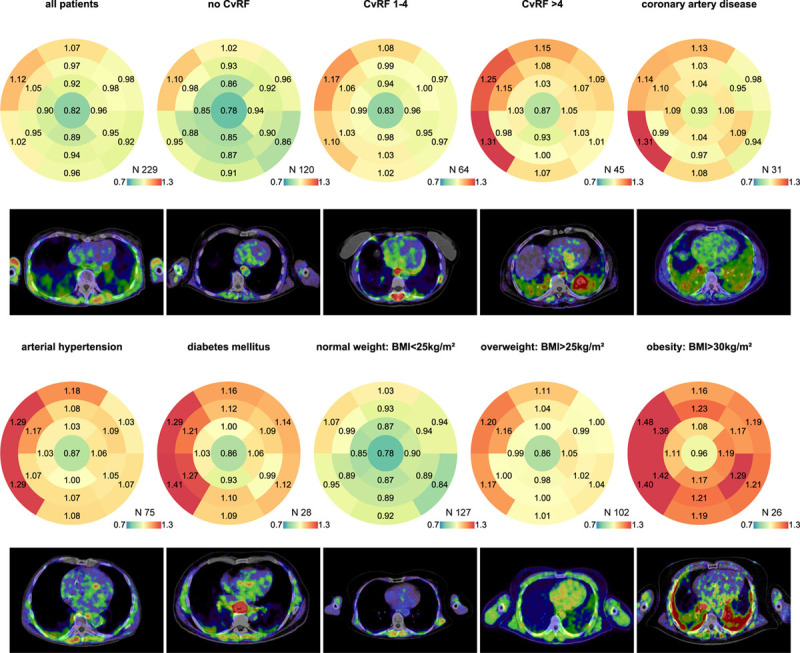
Figure 2.

Bullseye 17-segment analysis of different subgroups with representative FAPI (fibroblast activation protein inhibitor) images. The median signal intensity of the corresponding segment is displayed for each group. The number of patients in a group is seen in the right lower corner of each bullseye above the color scale. The color coding was taken from a spectral color scale ranging from 0.7 (blue) to 1.3 (red) with 1.0 (yellow) being the center. Representative FAPI images are displayed below. Signal intensity was generally increased in the septal basal segments. The apex exhibited the lowest signal intensity. This effect was most pronounced in arterial hypertension. Diabetes mellitus, arterial hypertension, and obesity—all risk factors associated with metabolic stress and cardiac remodeling—show the highest increase in FAPI signals. BMI indicates body mass index; and CvRF, cardiovascular risk factors.
