
Figure 1.
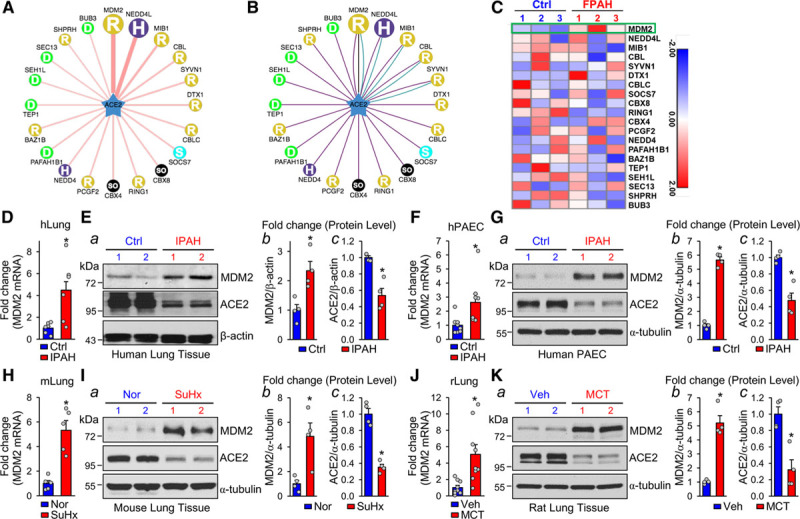
MDM2 level is elevated in PH. A and B, In the network view, a node is positioned in the center of the canvas showing the putative substrates, surrounded by nodes revealing predicted E3 ligases. The node colors and characters denote the E3 ligase type with the edge width and node size representing the confidence score. In the confidence mode (A), both edge width and node size are positively correlated with the UbiBrowser score. In the evidence mode (B), the edge of each predicted E3-substrate interaction consists of multiple colored lines, with distinct colors representing different types of supporting evidence, including E3-recognizing motif (blue), network loops (black), and enriched gene ontology pair (purple). C, RNA-sequencing data for predicted E3 ligases in induced pluripotent stem cell–derived endothelial cells. The heat map shows the expression of genes involved in patients with familial PAH (FPAH) with BMPR2 mutation versus controls. D and E, qPCR quantification of MDM2 mRNA levels and Western blot analysis of MDM2 and ACE2 levels in lung tissue from patients with IPAH (n=6) and controls without PAH (n=6). F and G, qPCR quantification of MDM2 mRNA level in PAECs isolated from IPAH (n=8) and control lungs (n=8) and Western blot analysis of MDM2 and ACE2 levels in PAECs isolated from IPAH (n=4) and control lungs (n=4). H through K, qPCR quantification of MDM2 mRNA level and Western blot analysis of MDM2 and ACE2 levels in the lung tissues of SuHx-induced PH mice (n=5) and control mice (n=5) (H and I) and MCT-induced PH rat models (n=9) versus controls (n=9) (J and K). Data are mean±SEM. For data with normal distribution (D, H, and J), statistical significance was determined by 2-tailed Student t test with Welch correction between 2 indicated groups. Nonnormally distributed data (E through G, I, and K) were analyzed using the Mann-Whitney U test between 2 indicated groups. *P<0.05 versus control patients (Ctrl) or Normoxia (Nor) or vehicle (Veh) controls. ACE2 indicates angiotensin-converting enzyme 2; IPAH, idiopathic pulmonary arterial hypertension; MCT, monocrotaline; MDM2, murine double minute 2; PAEC, pulmonary artery endothelial cells; PH, pulmonary hypertension; qPCR, quantitative polymerase chain reaction; and SuHx, SU5416/hypoxia.