
Figure 4.
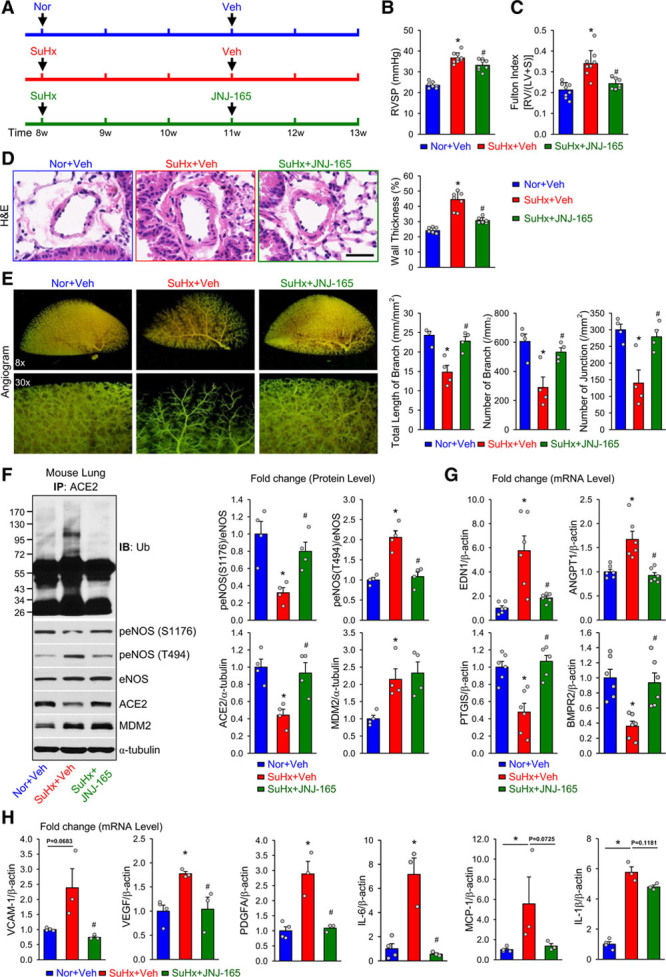
MDM2 inhibition alleviates experimental pulmonary hypertension in mice. A, Eight-week-old C57BL/6 mice were subjected to normoxia (Nor) or SuHx (10% O2 with subcutaneous injection of SU5416 at 20 mg·kg–1·wk–1) for 5 weeks. Nor and SuHx mice were given vehicle (Veh) or JNJ-165 (20 mg·kg–1·d–1) during the last 2 weeks by oral gavage. B and C, Summarized data (mean±SEM) showing right ventricular systolic pressure (RVSP, B) and Fulton index, the ratio of the weight of right ventricle (RV) to the weight of the left ventricle (LV) and septum (S) (RV/[LV+S], C) in Nor and SuHx mice treated with Veh or JNJ-165. D, H&E staining of pulmonary arteries (Left) and summarized data (mean±SEM, Right) showing the pulmonary arterial wall thickness from Nor+Veh, SuHx+Veh, and SuHx+JNJ-165 mice. Scale bar = 20 µm. E, Representative lung angiogram (Left) of the left lungs at 8× (Upper) and 30× (Lower) magnification from Nor+Veh, SuHx+Veh, and SuHx+JNJ-165 mice. Summarized data (mean±SEM, n=4 lungs, Right) showing the total length of branches, number of branches, and number of junctions of the left lungs from Nor+Veh, SuHx+Veh, and SuHx+JNJ-165 mice. F, Western blot analysis (Left) of eNOS phosphorylation at S1176 and T494, eNOS, ACE2, and MDM2, along with summarized data (mean±SEM, Right) showing the expression levels of peNOS (S1176), peNOS (T494), ACE2, and MDM2, in lung tissues from Nor+Veh, SuHx+Veh, or SuHx+JNJ-165 mice. G and H, Quantitative polymerase chain reaction analysis of endothelin-1 (END1), angiopoietin 1 (ANGPT1), prostacyclin synthase (PTGIS), and bone morphogenetic protein receptor II (BMPR2) mRNAs (G); vascular cell adhesion molecule 1 (VCAM-1), vascular endothelial growth factor (VEGF), platelet derived growth factor subunit A (PDGFA), interleukin 6 (IL-6), monocyte chemoattractant protein-1 (MCP-1), and interleukin 1β (IL-1β) (H) in lung tissues from Nor+Veh, SuHx+Veh, and SuHx+JNJ-165 mice. Data are mean±SEM (7–9 mice per group). Normally distributed data (B through D, and G) were analyzed by 1-way ANOVA test between multiple groups. Nonnormally distributed data (E and F) were analyzed using Kruskal-Wallis test between multiple groups. *P<0.05 versus Nor+Veh; #P<0.05 versus SuHx+Veh. ACE2 indicates angiotensin-converting enzyme 2; eNOS, endothelial nitric oxide synthase; H&E, hematoxylin and eosin; IB, immunoblotted; IP, immunoprecipitation; MDM2, murine double minute 2; and Ub, ubiquitin.