
Figure 6.
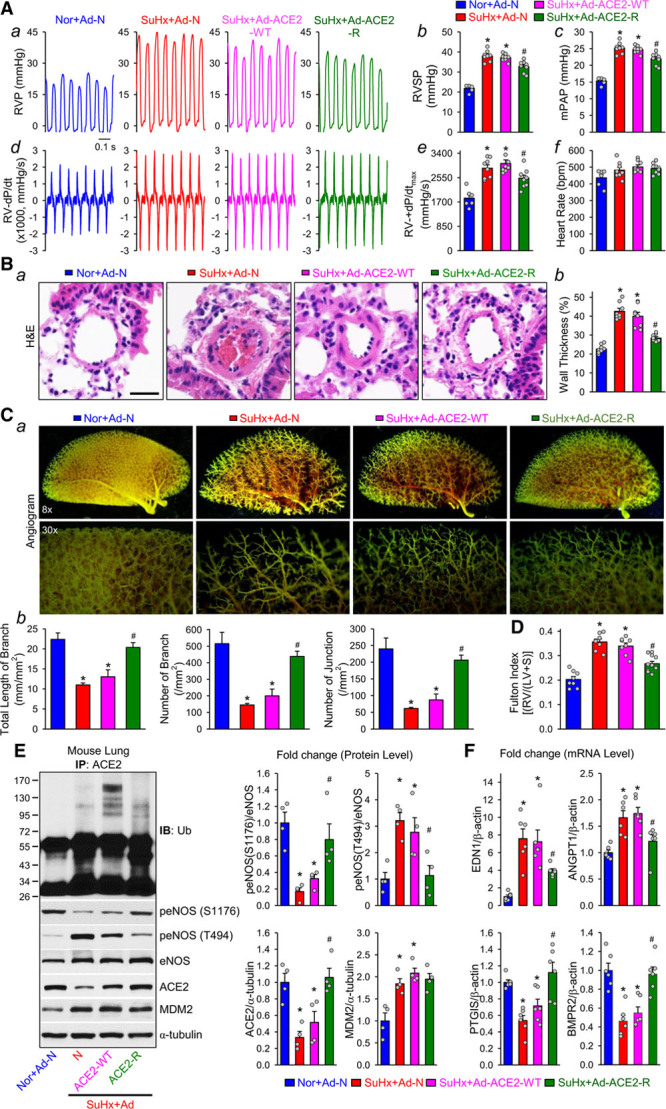
ACE2-K788R ameliorates pulmonary hypertension in EC-AMPKα2–/– mice. Eight-week-old EC-AMPKα2–/– mice were subcutaneously injected with SU5416 and exposed to hypoxia (10% O2) for 3 weeks before adenoviral infection was introduced intratracheally; the hemodynamic, histological, and angiogram measurements were conducted in the mice 2 weeks after adenoviral infection. A, Representative records of right ventricular pressure (RVP) (a), summarized RVSP (b), and estimated mean pulmonary arterial pressure (mPAP, calculated by the equation: mPAP=0.6 RVSP+2 mm Hg, (c) in normoxic mice receiving adenovirus null (Nor-Ad-N) and SU5416/Hypoxia (SuHx)–treated mice with adenoviral null (SuHx+Ad-N) or adenoviral infection of wild-type ACE2 (SuHx-ACE2-WT) and ACE2-K788R (SuHx+ACE2-R). Representative RV ±dP/dt (d) and summarized values of RV +dp/dtmax (e, mean±SEM) from Nor-Ad-N, SuHx+Ad-N, SuHx+ACE2-WT, and SuHx+ACE2-K788R mice are also shown. f shows averaged heart rate in Nor+Ad-N, SuHx+Ad-N, SuHx+ACE2-WT, and SuHx+ACE2-K788R mice. B, Histological images with H&E staining of pulmonary arteries (a) and summarized data (mean±SEM) showing the pulmonary arterial wall thickness (b) from Nor+Ad-N, SuHx+Ad-N, SuHx+ACE2-WT, and SuHx+ACE2-K788R mice. Scale bar = 20 μm. C, Representative lung angiogram (a) of the left lung at 8× (Upper) and 30× (Lower) magnification from Nor+Ad-N, SuHx+Ad-N, SuHx+ACE2-WT, and SuHx+ACE2-K788R mice. Summarized data (mean±SEM, n=5 mouse lungs, b) showing the total length of branches (Left), number of branches (Middle), and number of junctions (Right). D, Fulton index, the ratio of the weight of right ventricle (RV) to the weight of the left ventricle (LV) and septum (S) ([RV/LV+S]), in Nor+Ad-N, SuHx+Ad-N, SuHx+ACE2-WT and SuHx-ACE2-K788R mice. E, Immunoprecipitation (IP) and Western blot analyses (Left) on Ub, peNOS at S1176 and T494, eNOS, ACE2, and MDM2, along with summarized data (mean±SEM) showing the expression levels of peNOS S1176, peNOS T494, ACE2, and MDM2, in lung tissues from Nor+Ad-N, SuHx+Ad-N, SuHx+ACE2-WT, and SuHx+ACE2-R mice. F, qPCR analysis of END1, ANGPT1, PTGIS, and BMPR2 transcripts in lung tissues from Nor+Ad-N, SuHx+Ad-N, SuHx+ACE2-WT, and SuHx+ACE2-R mice. Data are mean±SEM (6–10 mice per group). Normally distributed data (A, B, and D) were analyzed by 1-way ANOVA test between multiple groups. Nonnormally distributed data (C, E, and F) were analyzed using the Kruskal-Wallis test between multiple groups. *P<0.05 versus Nor+Ad-N; #P<0.05 versus SuHx+Ad-N and SuHx+ACE2-WT. ACE2 indicates angiotensin-converting enzyme 2; ANGPT1, angiopoietin 1; BMPR2, bone morphogenetic protein receptor II; END1, endothelin-1; eNOS, endothelial nitric oxide synthase; H&E, hematoxylin and eosin; MDM2, murine double minute 2; PTGIS, prostacyclin synthase; RVSP, right ventricular systolic pressure; and Ub, ubiquitin.