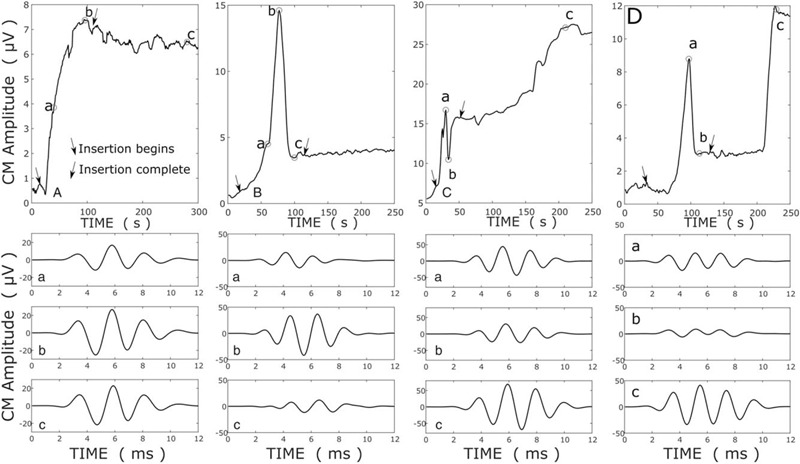
FIG. 1.

In the upper panels, ECochG amplitude growth is plotted over a routine cochlear implantation (A) and three examples of ECochG drops (B–D) are presented. The amplitude of “DIF” signal (the difference between responses to rarefaction and condensation 500 Hz tone pips) is a plotted against time from the beginning of the electrode insertion. The lower three panels show the ECochG traces at the times (a, b, c) indicated on the upper panel. ECochG indicates electrocochleographic.
