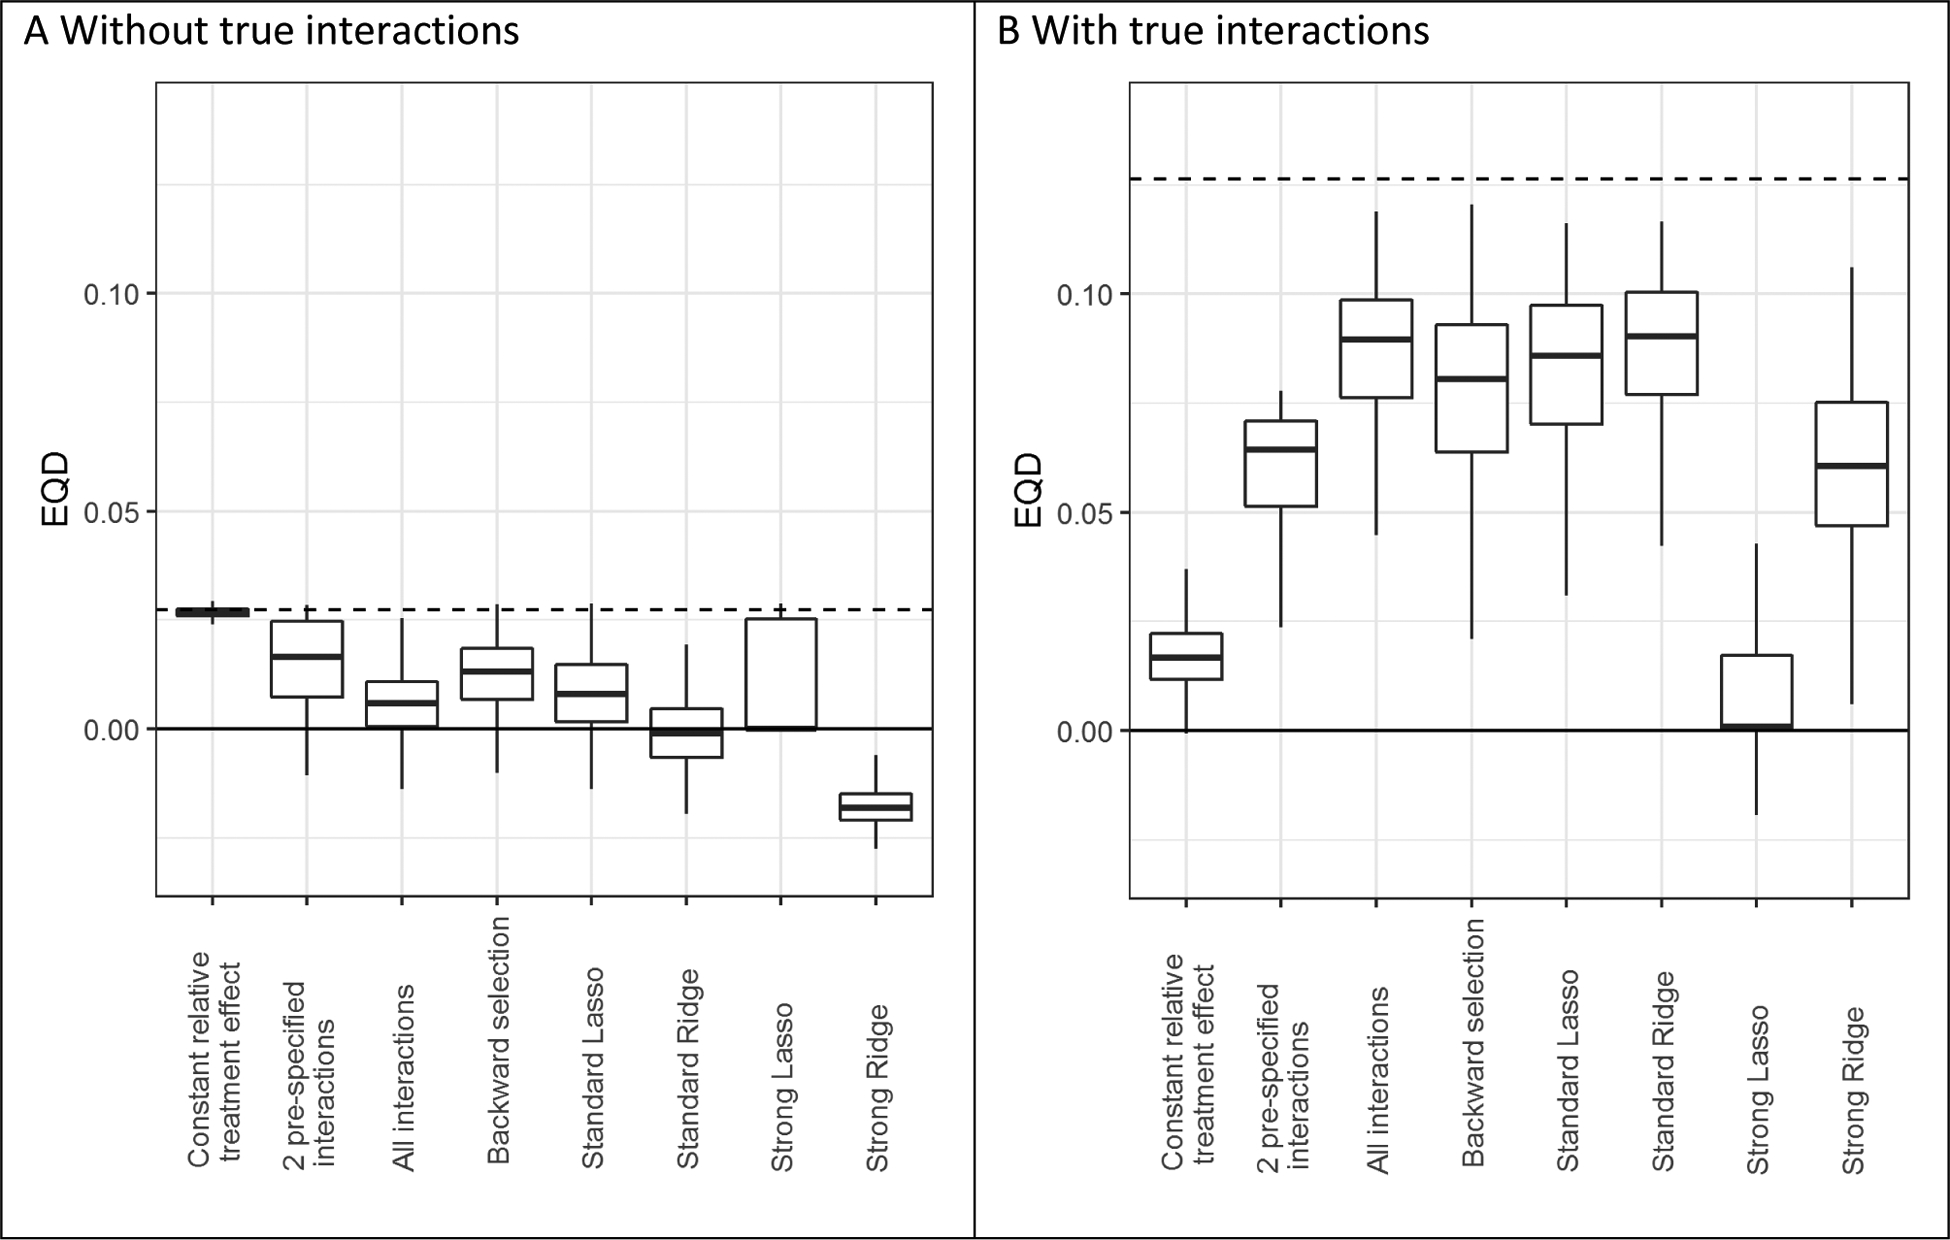
Figure 4. The risk modeling approach (Constant relative treatment effect) discriminated best in the absence of true interactions, but left considerable treatment benefit heterogeneity undetected in the presence of true interactions.

Extreme quartile difference (EQD) represents the difference between the observed benefit in the fourth quartile and the observed benefit in the first quartile of the population in base case simulation scenarios without true interactions (panel A) and with true interactions (panel B). The maximum achievable EQD of the true model is represented by the dashed horizontal lines. In the presence of true interactions (B), penalized regression approaches (Standard Lasso and Standard Ridge) discriminated similarly to unpenalized regression (All interactions).
