
Fig. 3.
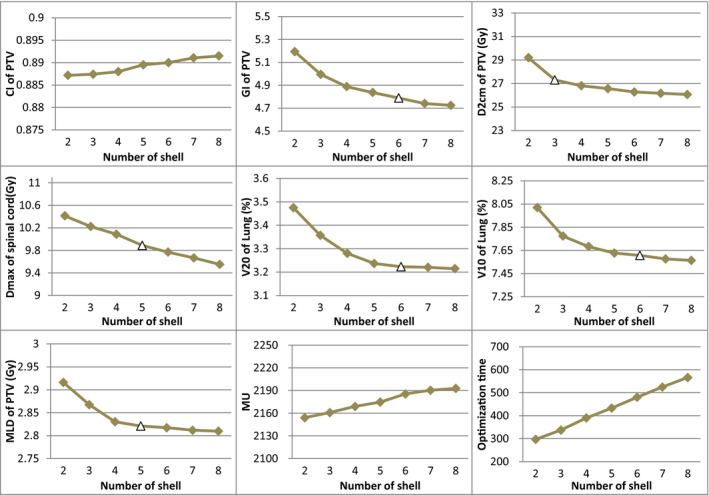
Line charts of criteria in different plans (The triangle (△) represents optimal dose‐limiting shells).
Official websites use .gov
A
.gov website belongs to an official
government organization in the United States.
Secure .gov websites use HTTPS
A lock (
) or https:// means you've safely
connected to the .gov website. Share sensitive
information only on official, secure websites.
Line charts of criteria in different plans (The triangle (△) represents optimal dose‐limiting shells).