
Fig. 3.
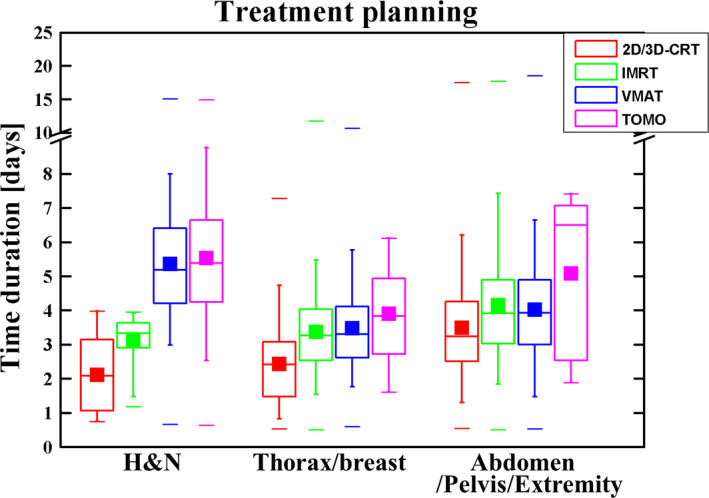
Time utilization for treatment planning using different treatment techniques (2D/3D‐CRT, IMRT, VMAT, and TomoTherapy) of different tumor sites. Median with 25% and 75% quartiles (boxes), mean (filled squares), maximum and minimum (lines), and 5% and 95% percentiles (whiskers) are shown.