
Fig. 6.
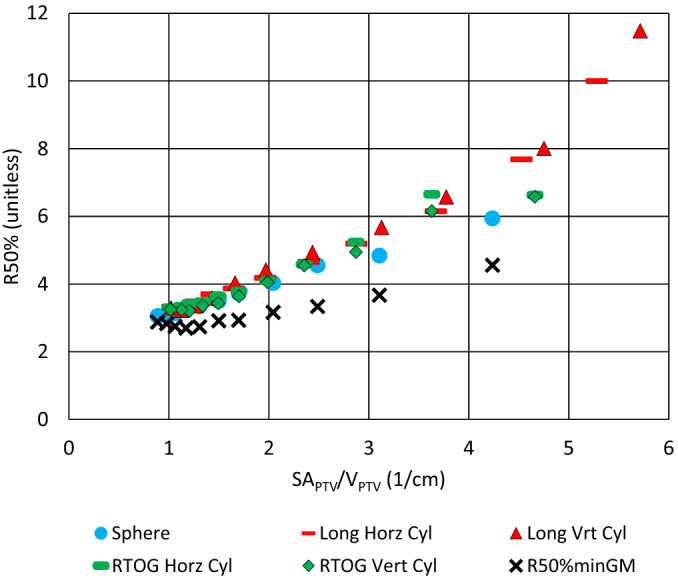
The graph R50% vs SAPTV/VPTV showing all 55 plans of the Surface Area study. Also shown is R50%minGM [Eq. (15)] using the GM values from Hoffman et al. 20 Notice that the lower bound R50%minGM is always <R50% for all plans and thus is indeed a lower bound.