
Fig. 3.
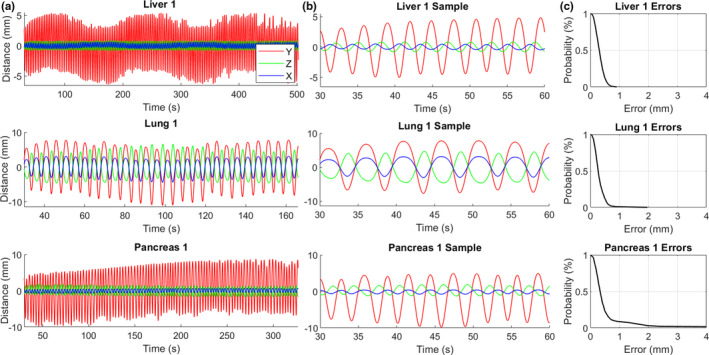
(a) Examples of treatment‐length phantom motion traces for three subject cases. (b) 30‐s samples of the phantom motion traces. (c) Cumulative tracking error plots showing the probability of observing a tracking error greater than the specified value throughout the treatment.