
Fig. 6.
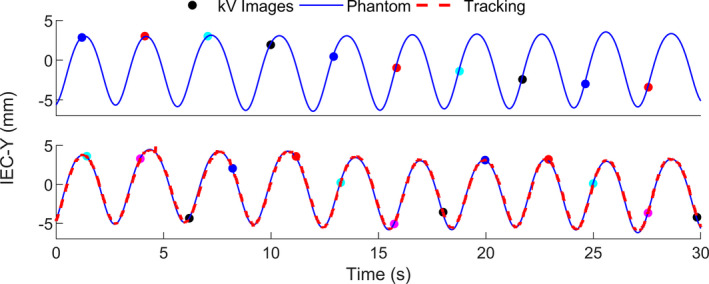
30‐s sample of Synchrony‐modeled motion (“Tracking”) vs phantom motion in the IEC‐Y direction for Liver 1 with four images per gantry rotation (top) and five images per gantry rotation (bottom). Multicolored points indicate the phase at times which the kV images were acquired (four colors in the top and five colors in the bottom). When imaging with four images per gantry rotation, the imaging frequency was found to alias with the breathing frequency and the model was not accurately built (hence there is no tracking curve in the top image).