Fig. 5.

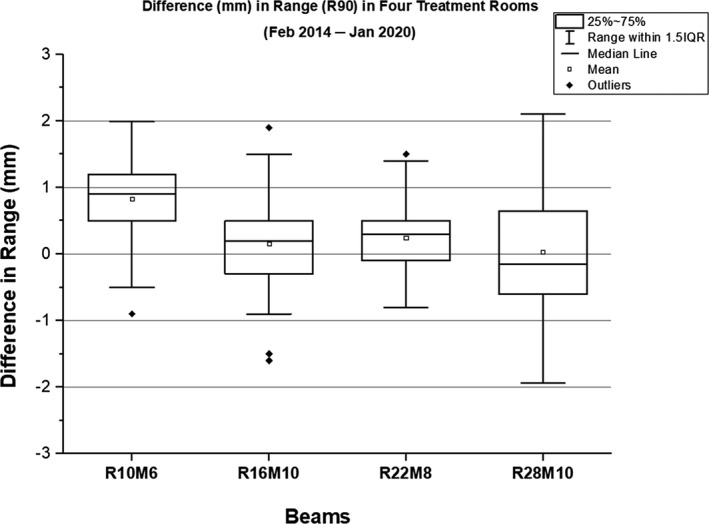
A box‐whisker plot showing the difference in range of four monthly quality assurance beams. For a given range, the results are combined from all treatment rooms.

A box‐whisker plot showing the difference in range of four monthly quality assurance beams. For a given range, the results are combined from all treatment rooms.