Fig. 1.

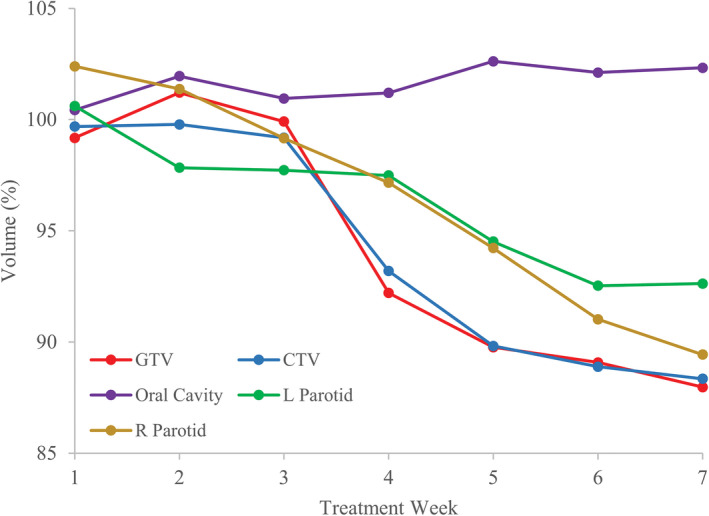
Percentage of median volume at 1st fraction of each week in the treatment course with respect to the volume from the planning computed tomography.

Percentage of median volume at 1st fraction of each week in the treatment course with respect to the volume from the planning computed tomography.