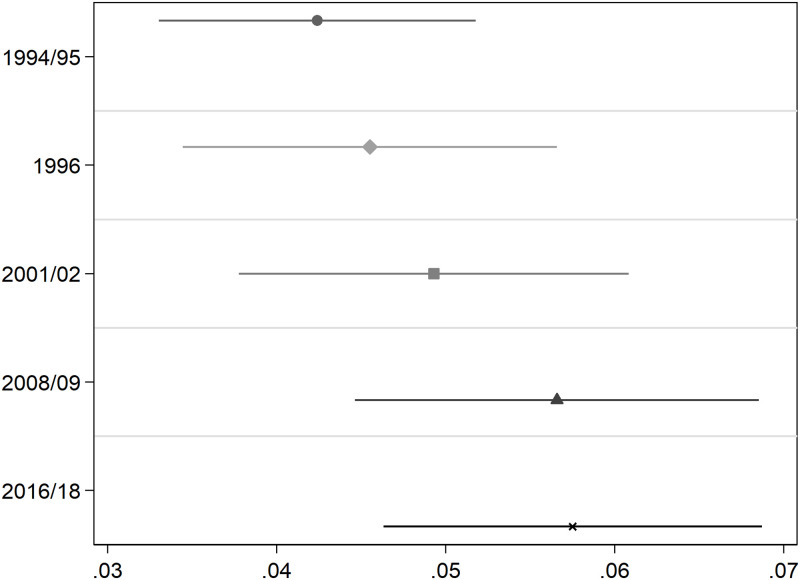
Fig 3. Association between BMI polygenic scores and Log(BMI) along the life-cycle.
Add Health Cohort. This Figure summarizes the results of estimating Eq 2 on the balanced sample of 2,730 Add Health cohort members described in Table 2. The dependent variable is Log(BMI). OLS coefficient estimates of β1 as well as their associated 95% confidence intervals are depicted. All regressions include a female dummy, age, age squared, and the first 10 principal components of the full matrix of genetic data. Standard errors are clustered at the school level. Longitudinal weights are used.

