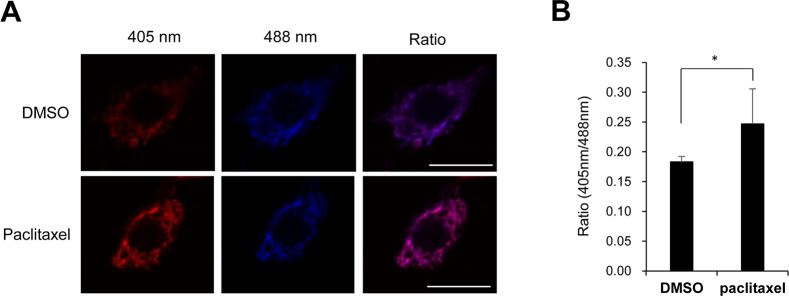
Fig 4. Increased mitochondrial ROS upon paclitaxel treatment in C4da neurons.
(A) Representative fluorescence images of C4da sensory neurons at abdominal segment A4 in L3 larvae expressing the in vivo mitochondrial H2O2 probe mito-roGFP2-Orp1 (ppk>mito-roGFP2-Orp1) with either DMSO or paclitaxel (20 μM) for 48 h. Scale bars, 10 μm. (B) Quantitative analysis of the mitochondrial ROS levels of the C4da sensory neurons in each group (n = 4 or 5 per group). The results are presented as the mean values, and the error bars represent the SD. *P <0.05 as determined by Student’s t-test.

