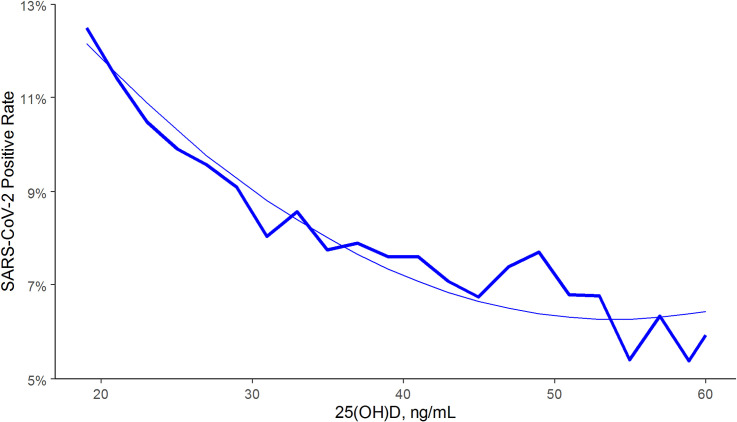
Fig 1. SARS-CoV-2 NAAT positivity rates and circulating 25(OH)D levels in the total population.
Smooth line represents the weighted second order polynomial regression fit to the data associating circulating 25(OH)D levels (x) and SARS-CoV-2 positivity rates (y) where: y = 0.2029–0.0052*x + 4.8e-05*x2; R2 = 0.96. SI conversion factor: 1 ng/mL = 0.400641 nmol/L.

