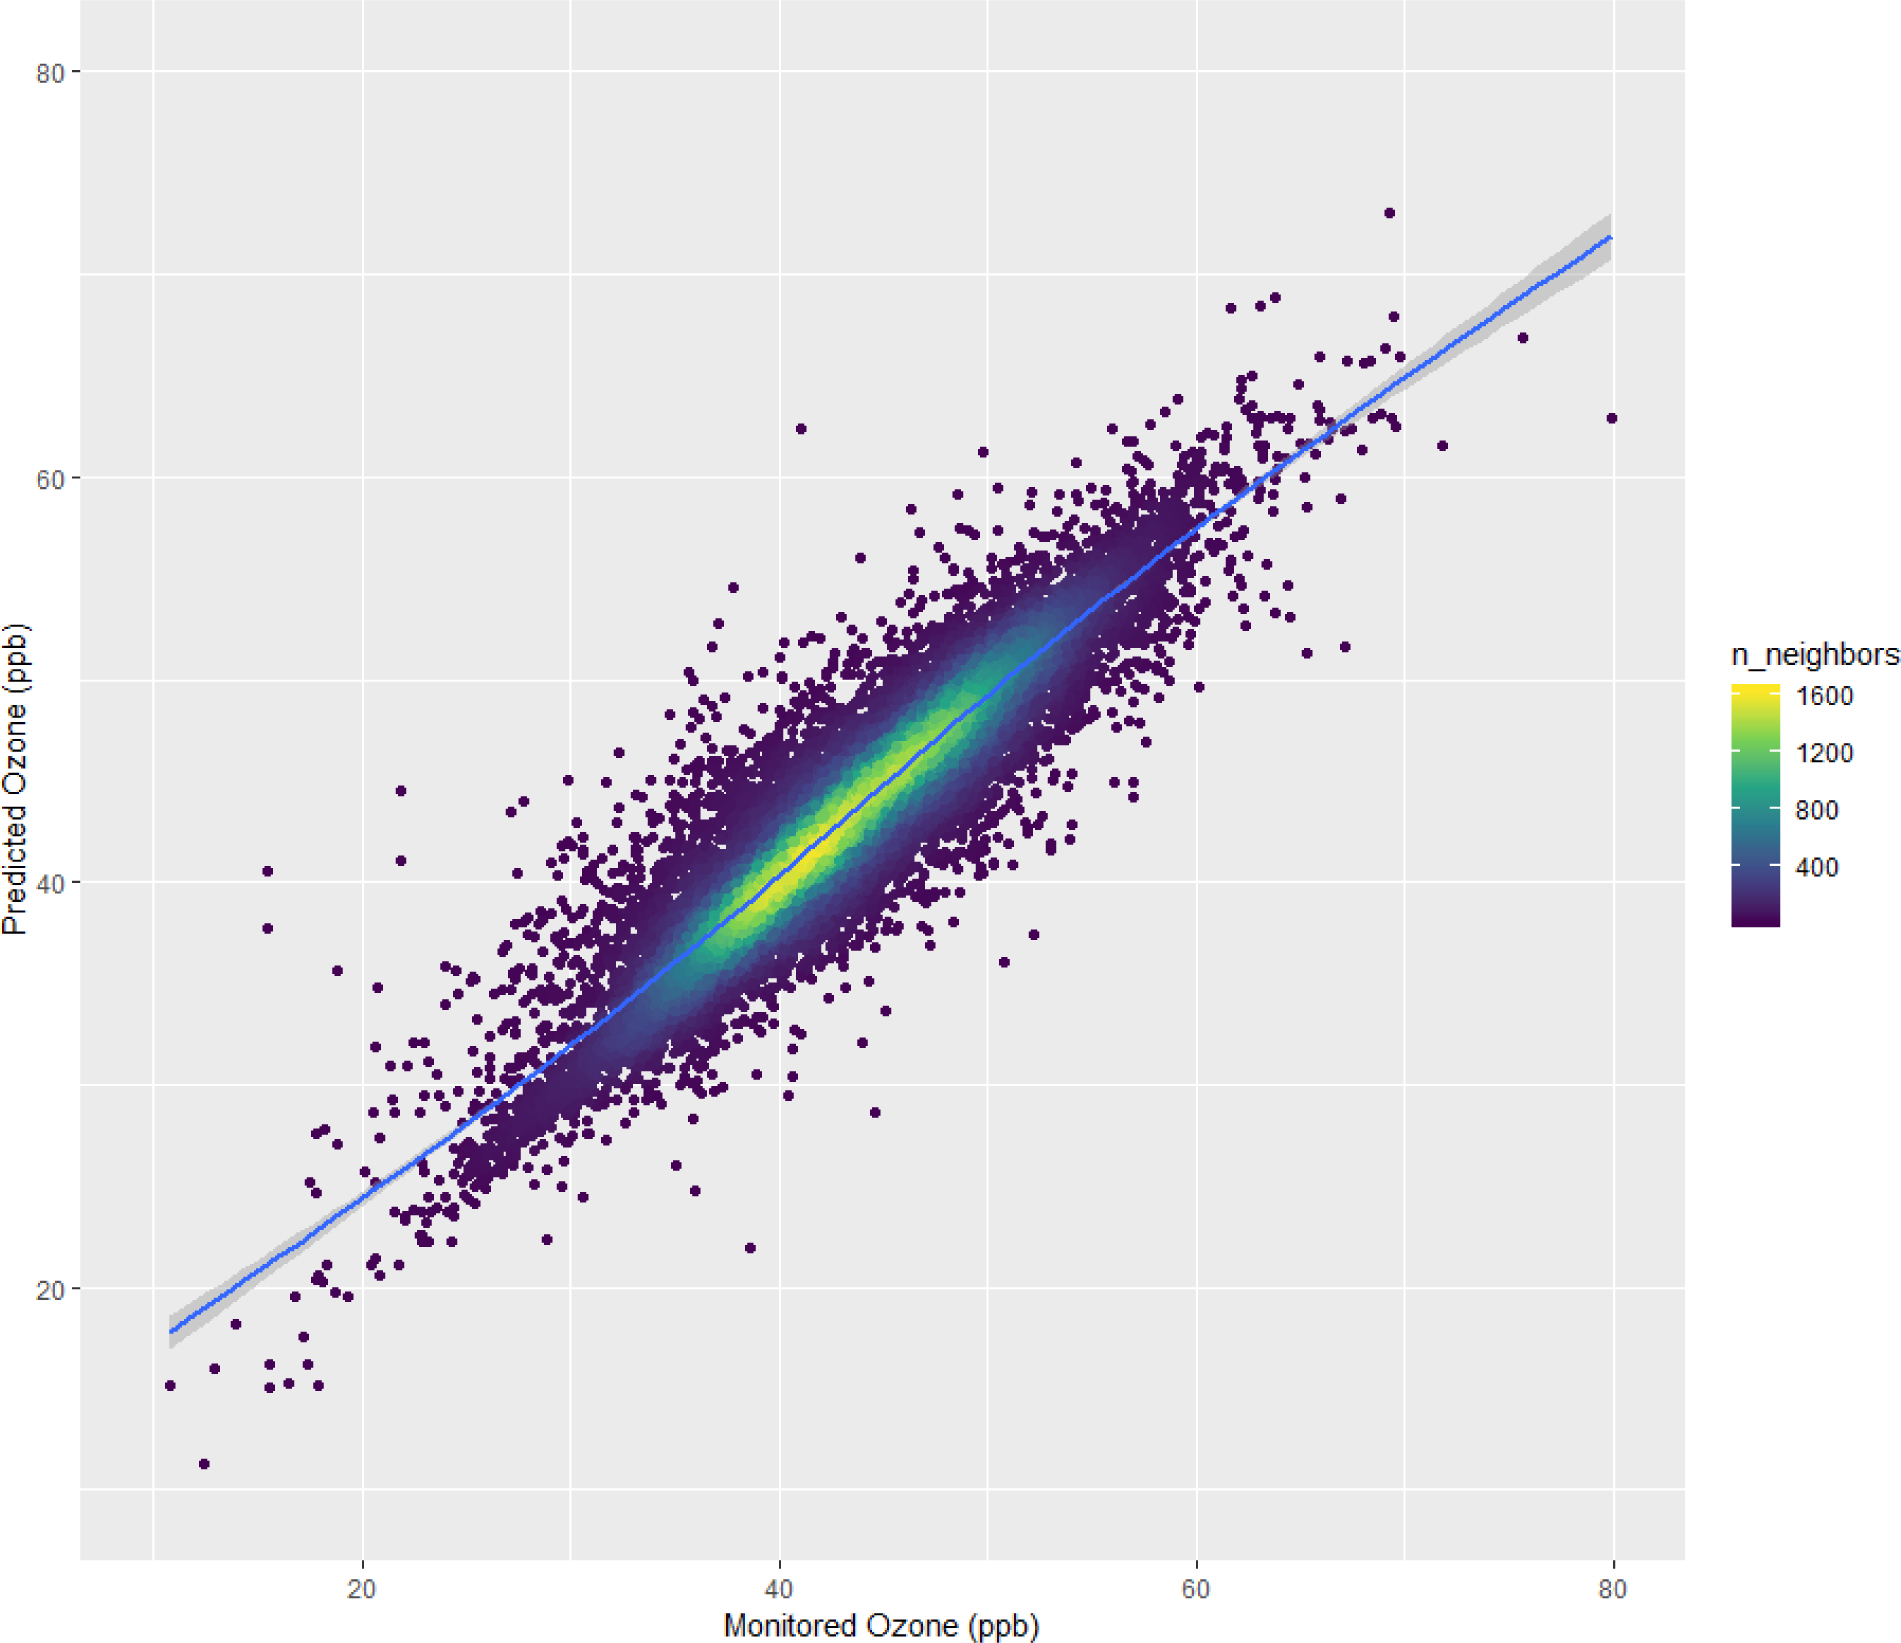
Figure 1 –

Density scatter plot of the annual predicted O3 levels versus measured levels for the ensemble model.
Note 1: We regressed annual averaged predicted O3 from ensemble model against annual averaged monitored O3 using a GAM model with spline on the monitored O3. Blue color represents 95% confidence interval.
Note 2: “n_neighbors” represents the density of points (O3 sites) of the scatter plot.
