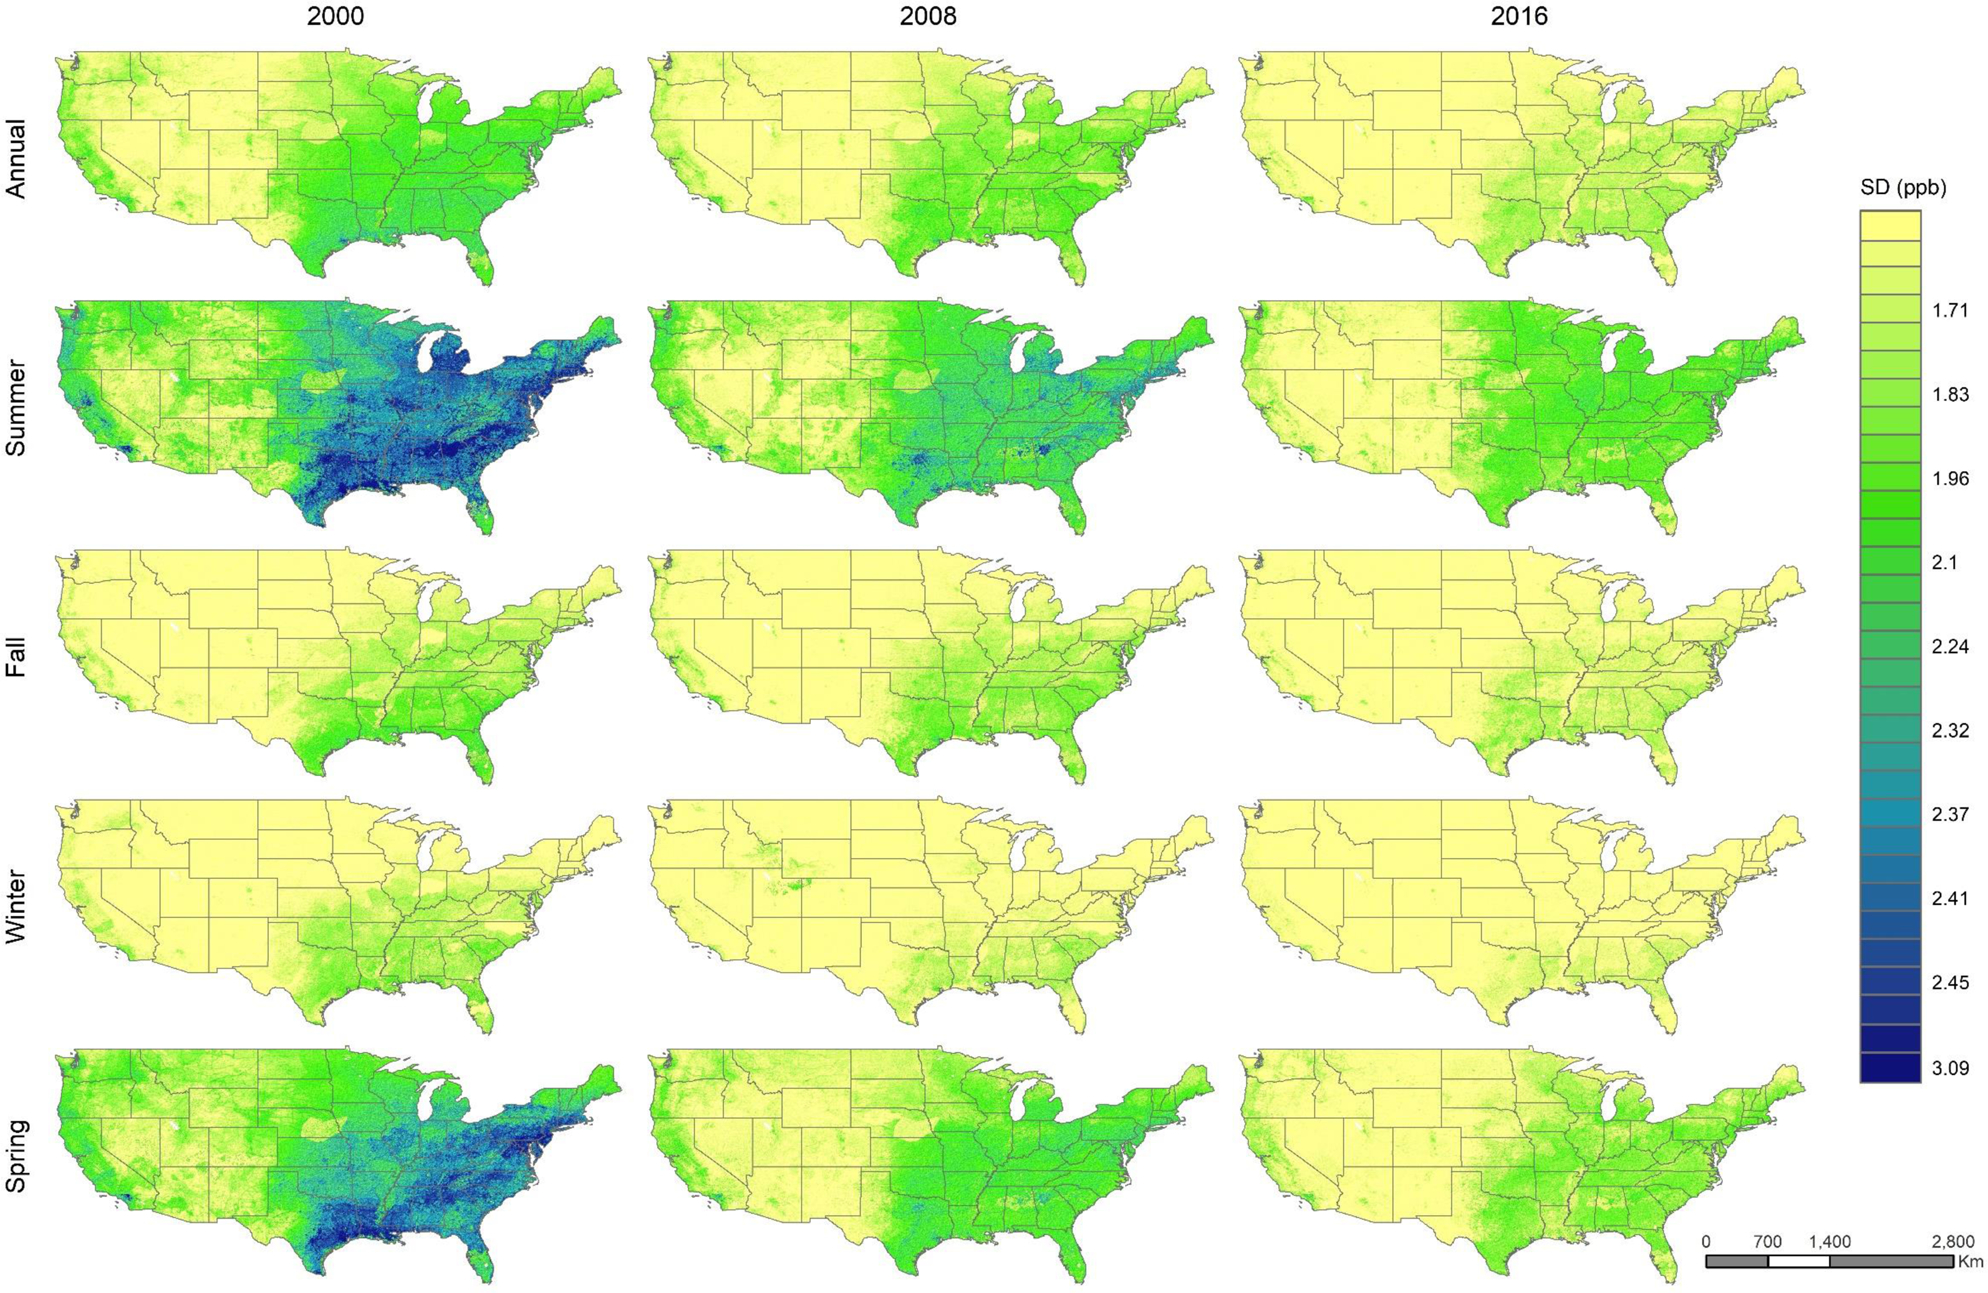
Figure 2 –

Spatial distribution of the standard deviation of the prediction error (SD) of O3 by season.
Note: The seasons were defined as follows: summer (July – September), fall (October – December), winter (January – March), and spring (April – June).
