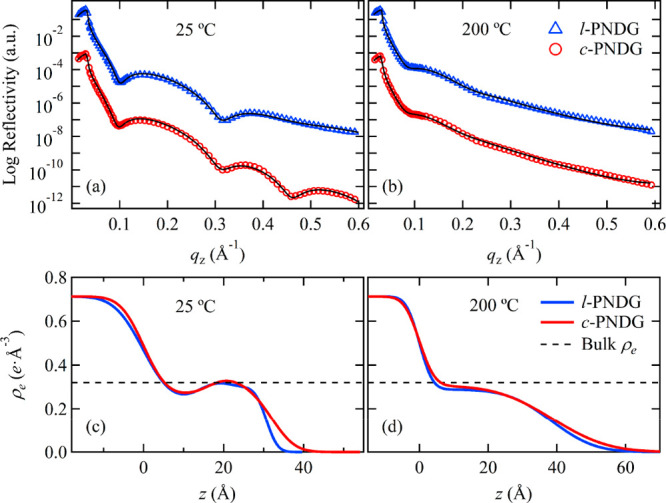
Figure 6.

(a, b) XRR curves of the c-PNDG (red circles) and l-PNDG (blue triangles) residual layers (i.e., irreversibly adsorbed layers) measured at (a) 25 °C and (b) 200 °C in situ, respectively. The solid black line corresponds to the best fits to the data based on the electron density (ρe) profile against the distance (z) from the Si surface shown in (c, d). The dotted line in (b) corresponds to the ρe value of bulk PNDG with a density of 0.95 g/cm3.
