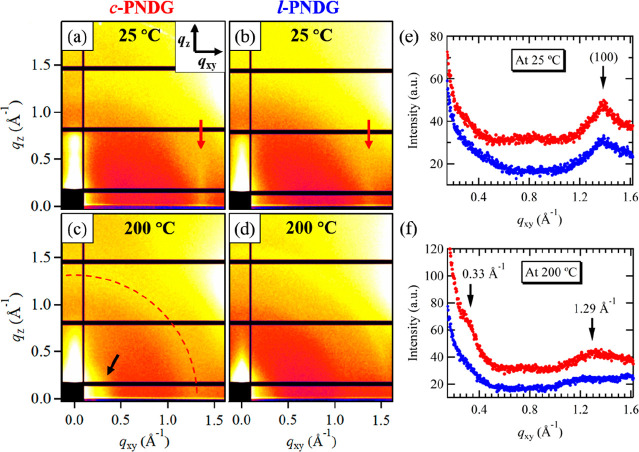
Figure 7.
(a–d) 2D GIWAXD images of the (a, c) c-PNDG and (b, d) l-PNDG adsorbed layers on a Si substrate measured at 25 and 200 °C. (e, f) Line-cut GIWAXD profiles of the c-PNDG (red dots) and l-PNDG (blue dots) adsorbed layers along the qxy direction measured at (e) 25 and (f) 200 °C. Note that the 1D GIWAXD intensity data have been shifted vertically for clarity. The (100) peak position is indicated by the red arrows shown in (a) and (b). The red dashed line in (c) is to guide the eye. In (c), the reflection at q = 0.33 Å–1 is indicated by the black arrows.

