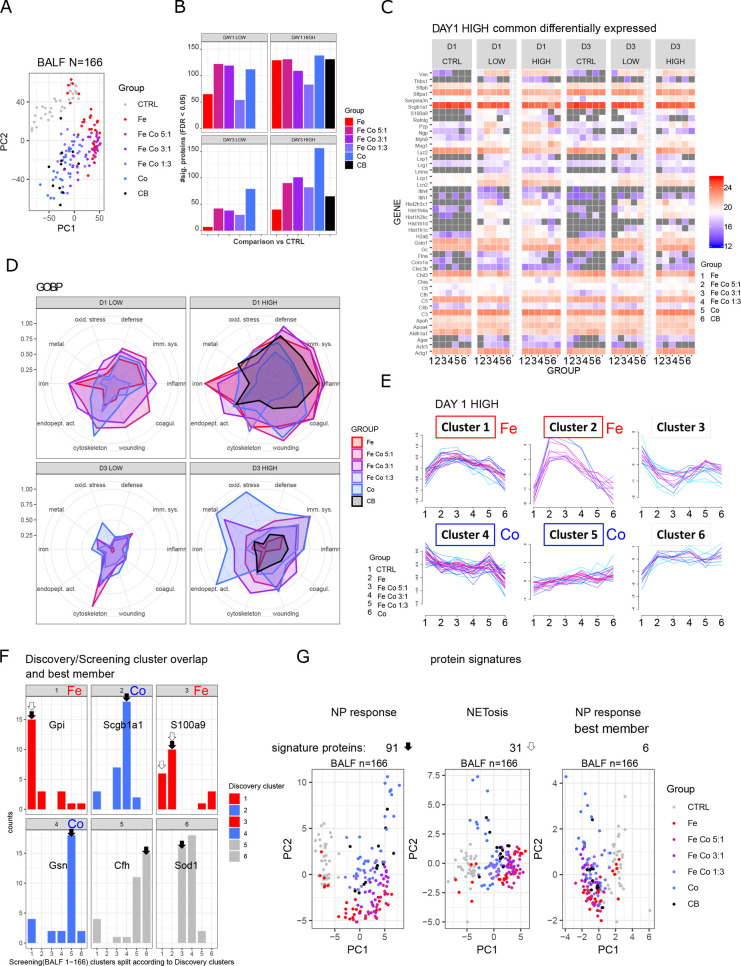
Figure 4.
Fast screening of BALF proteome by highly reproducible Evosep LC system, screening phase. (A) Principal component analysis of BALF samples of all animals (n = 166). (B) Numbers of differentially expressed proteins (FDR < 0.05) per treatment group. All comparisons were made against pooled controls per time point. (C) Common proteins which show differential expression upon metal oxide nanoparticles treatment (high concentration) at day one postinstillation. (D) Normalized enrichment for 10 selected GOBP terms for comparisons among the four experimental conditions (D1 LOW, D1 HIGH, D3 LOW, D3 HIGH). The maximal −log10(FDR) value per enrichment term over all conditions was set to 1. Abbreviations of enriched terms: defense (defense response), imm. sys. (immune system process), inflamm. (inflammatory response), coagul. (blood coagulation), wounding (response to wounding), cytoskeleton (actin cytoskeleton organization), endopet. act. (regulation of endopeptidase activity), iron (iron ion homeostasis), metal (response to metal ion), oxid. stress (response to oxidative stress). (E) Fuzzy c-means clustering of differentially expressed proteins (FDR < 0.05) from day 1 postinstillation with 162 μg nanoparticles/animal (DAY 1 HIGH). Clusters of proteins with specific response for iron oxide or cobalt oxide are annotated (red, iron oxide; blue, cobalt oxide). (F) Overlapping significant differentially expressed proteins from the discovery and screening phases are shown. Distribution of cluster assignment is depicted. Protein members of clusters with best matching pattern were selected (black arrow), representing a signature of 91 proteins (NP response). Based on the highest combined membership values, one protein per cluster was selected (annotated gene name), representing a signature of six proteins (NP response best member). Based on the iron oxide response pattern (white arrow), 31 proteins were selected, representing a NETosis signature. (G) Principal component analyses of the whole data set filtered for the three protein signatures: NP response, NETosis, and NP response best member with 91, 31, and 6 proteins, respectively, resemble grouping of total BALF screening.

