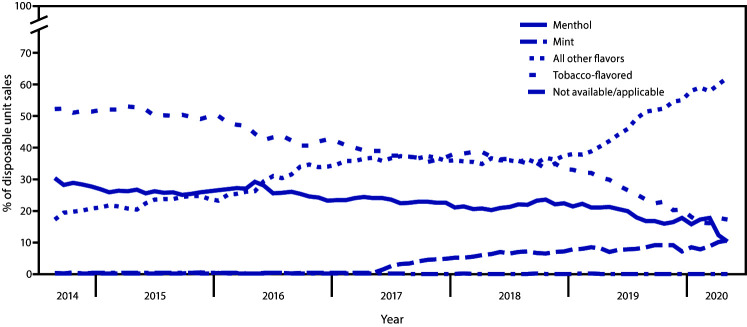
FIGURE 3.
Percentage of disposable e-cigarette* unit sales,† by flavor§— United States, September 14, 2014–May 17, 2020
* Disposable devices include nonrechargeable and nonreusable e-cigarette devices that are not intended to be refilled with e-liquid after being depleted; the device is disposed of once the e-liquid has been consumed. Unit sales were standardized to reflect the most common package size for each product type; a standardized unit was equal to 1 disposable device.
† Retail sales data were obtained from Information Resources, Inc. (IRI) for convenience stores, gas stations, grocery stores, drugstores/pharmacies, mass merchandiser outlets, club stores, dollar stores, and military sales; data from the Internet and vape shops were not collected.
§ The “All other flavors” category includes fruit, clove/spice, chocolate, alcoholic drink (such as wine, cognac, or other cocktails), candy/desserts/other sweets, or some other flavor. Unknown flavors were excluded from this figure (<0.1%).

