
Figure 1:
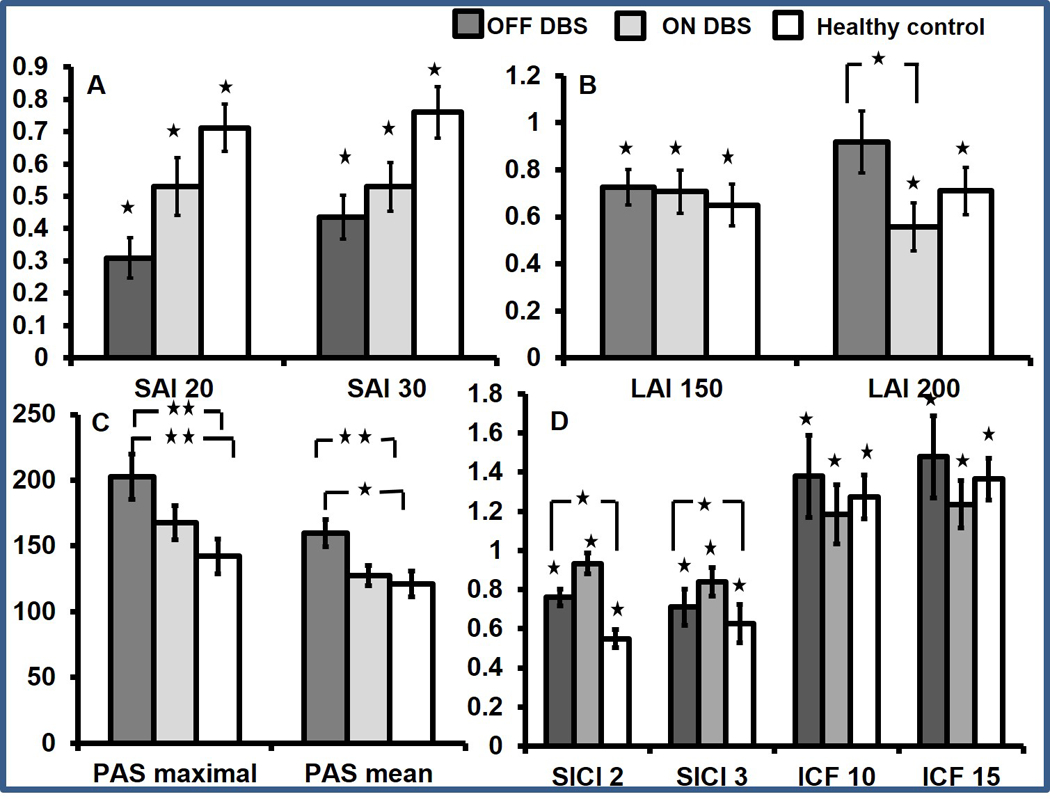
Figure 1 (A) Group average data on short latency afferent inhibition (SAI) in patients with cervical dystonia during DBS OFF and ON and in healthy controls. Compared with test pulse, SAI is significant only when single stimulation paradigm is applied. In comparison with healthy controls, SAI is significantly increased. SAI is found to be increased at interstimulus interval (ISI) of 20 and 30 ms in the presence of single median nerve stimulation when DBS is turned off. The x-axis indicates the groups and the ISIs studied. The y-axis shows afferent inhibition as ratios of the conditioned (test stimulus with preceding peripheral nerve stimulation) to the unconditioned (test stimulus alone) MEP amplitude. Values <1 indicate afferent inhibition. Dark grey bar represents DBS OFF, light grey represents DBS ON, and white bar represents healthy control subjects. Error bars represent SEs. Asterisks above the bars indicate significant inhibition compared with test pulse alone. Asterisks between the bars indicate significant difference between the groups (factorial ANOVA and post hoc testing). *P<0.05. (B) Group average data on long latency afferent inhibition (LAI) in patients with cervical dystonia during DBS OFF and ON and in healthy controls. Compared with test pulse LAI is significant only when single stimulation paradigm is applied. LAI is found to be reduced at an ISI of 200 ms in the presence of single median nerve stimulation when DBS is turned off. LAI does not change with DBS when dual nerve stimulation is used. The x-axis indicates the groups and the ISIs studied. The y-axis shows afferent inhibition as ratios of the conditioned (test stimulus with preceding peripheral nerve stimulation) to the unconditioned (test stimulus alone) MEP amplitude. Values <1 indicate afferent inhibition. Dark grey bar represents DBS OFF, light grey represents DBS ON, and white bar represents healthy control subjects. Error bars represent SEs. Asterisks above the bars indicate significant inhibition compared with test pulse alone. Asterisks between the bars indicate significant difference between the groups (factorial ANOVA and post hoc testing). *P<0.05. (C) Paired associative stimulation (PAS) MEP amplitudes are shown. PASmaximal and PASmean (MEP average over three time points) recorded from the Abductor pollicis brevis (APB) muscle after the PAS protocol is employed. The data are plotted as a ratio to the baseline MEP amplitude. Ratios higher than 1 indicate facilitation and ratios below 1 indicate inhibition. PASmaximal and PASmean are seen to increase when DBS is turned off. Error bars represent SEs. Asterisks between the bars indicate significant difference between the groups (factorial ANOVA and post hoc testing). *P<0.05, **P<0.01. (D) Group average data on short interval intracortical inhibition (SICI) and intracortical facilitation (ICF) in patients with cervical dystonia during DBS OFF and ON and in healthy controls. Compared with test pulse SICI and ICF are significant for all three groups. SICI significantly increased compared with healthy controls during DBS OFF. However, there are no effects of DBS on SICI and ICF. The x-axis indicates the groups and the ISIs studied. The y-axis shows afferent inhibition as ratios of the conditioned (test stimulus with preceding peripheral nerve stimulation) to the unconditioned (test stimulus alone) MEP amplitude. Values <1 indicate inhibition and values >1 indicate facilitation. Dark grey bar represents DBS OFF, light grey represents DBS ON, and white bar represents healthy control subjects. Error bars represent SEs. Asterisks above the bars indicate significant inhibition compared with test pulse alone. *P<0.05. ANOVA, analysis of variance; DBS, deep brain stimulation; MEP, motor evoked potential.