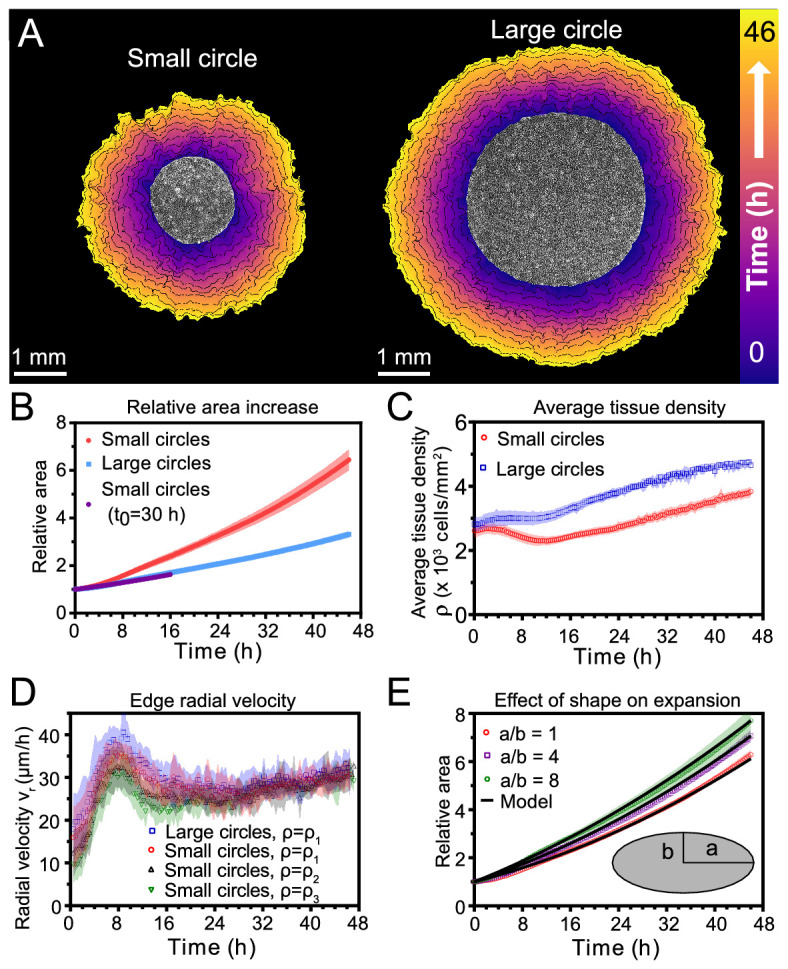
Figure 1. Expansion dynamics of millimeter-size cell monolayers.
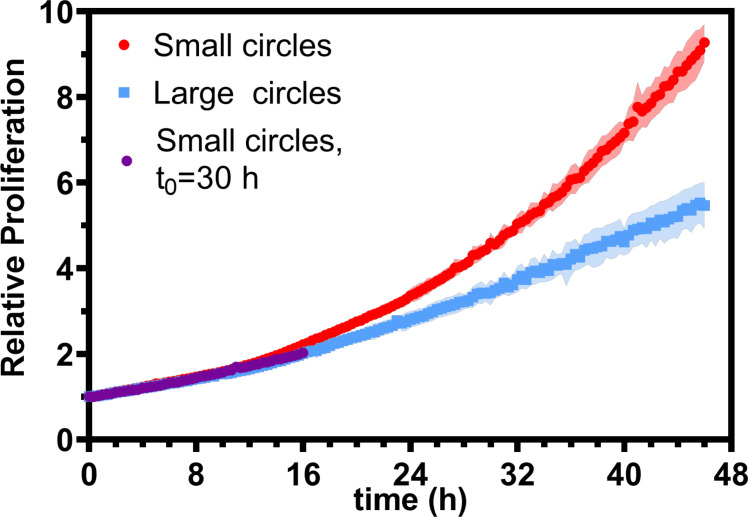
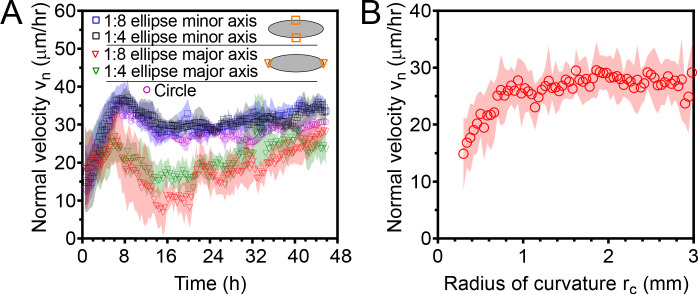
(A) Footprint throughout 46 hr growth period of representative small (left) and large (right) circular tissues, with the tissue outlines drawn at 4 h increments. Initial diameters were 1.7 mm and 3.4 mm. (B) Small circles exhibit faster relative area, , increase than large circles, where A0 and are the areas of tissues at the beginning of the experiment and at time t, respectively. Purple points show the relative area increase, , of small tissues from the time h when they reached the size of the large circles. (C) Average tissue density has non-monotonic evolution in small tissues but monotonically increases in large tissues, where is the number of cells in a tissue at time t. (D) Edge radial velocity vr is largely independent of initial tissue size and cell density. We grouped initial cell densities as cells/mm2, cells/mm2, and cells/mm2. (E) Experimental data on tissue shape and model fits. Assuming a constant migration speed vn in direction normal to the edge, we can predict the area expansion dynamics of elliptical tissues with different aspect ratios. The model fits our data for all tissues with µm/hr, yielding normalized values of 0.79, 0.13, and 0.06 for aspect ratios of 8, 4, and 1 respectively (< 1 indicates a good fit; see Materials and methods). In B, data are from n = 16 tissues across five independent experiments (small and large circles). In C, n = 11 across four experiments for small circles, and n = 9 across three experiments for large circles. In D, n = 16 across five independent experiments for small and large circles, ; n = 13 across three experiments for small circles, ; and n = 11 across three experiments for small circles, . In E, n = 4 across two experiments for a/b = 1 and a/b = 4, and n = 5 across two experiments for a/b = 8. Shaded regions correspond to standard deviations.


