
Figure 2. Speed and radial velocity in inner and outer tissue zones.
(A,B) Average kymographs of (A) speed and (B) radial velocity vr throughout expansion for small (left) and large (right) tissues. (C) Evolution of the average speed of boundary (top) and center (bottom) zones, defined as regions extending ∼200 μm from the tissue center and tissue edge, respectively. This width of the zones corresponds approximately to the velocity-velocity correlation length for MDCK cells (Petitjean et al., 2010). While the speed in the edge zone remains high in both small and large tissues, the speed in the center zone begins to decrease ∼24 hr sooner in large tissues than in small tissues, as the central zone of the small tissues has particularly high speed from 18 to 36 hr. (D) Profiles of speed (top) and radial velocity (bottom) at 36 hr, from the edge of the tissue inwards. Arrows indicate that the tissues are indexed from the edge of the tissue inwards. All data are from n = 16 tissues across five independent experiments (small and large circles). Speed and radial velocity profiles of large and small tissues match closely for the first 500 μm from the tissue edge. The average difference between the profiles in this zone is 0.39 μm/h (speed) and 0.27 μm/h (radial velocity), respectively, while the smallest standard deviation for any point in either profile is 0.56 μm/h.
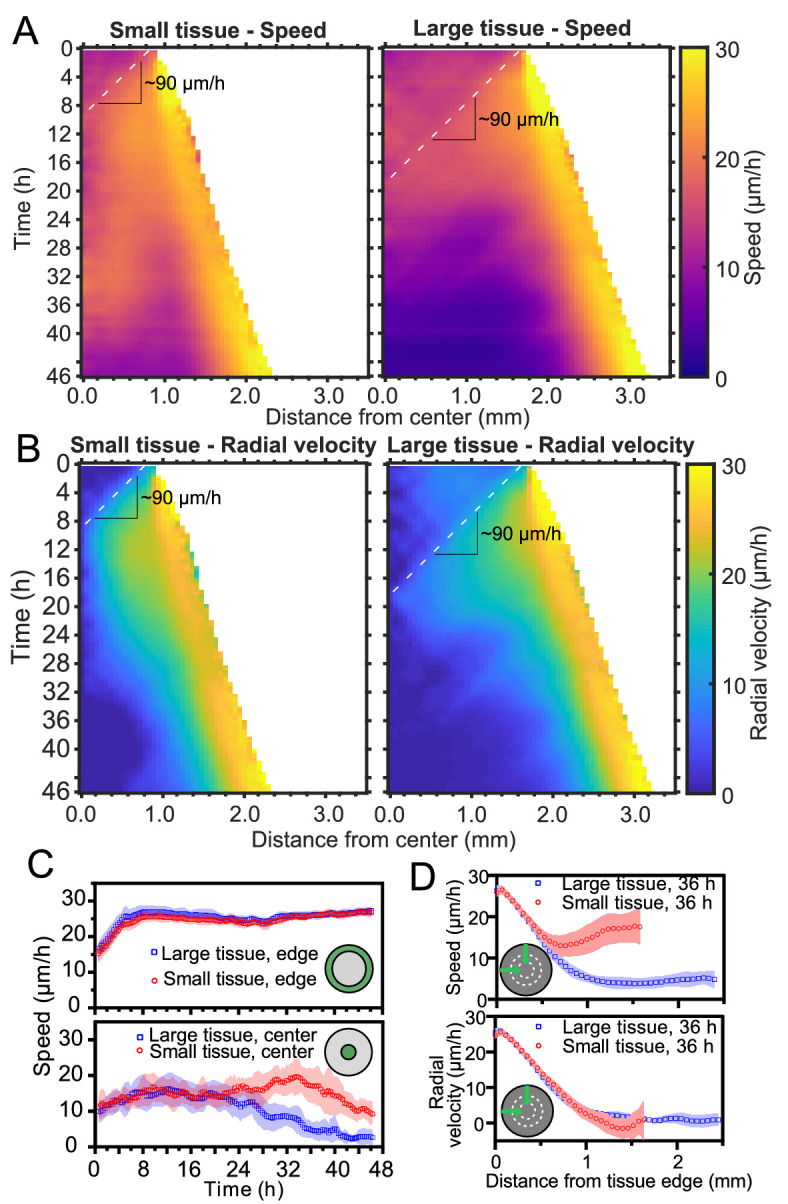
Figure 2—figure supplement 1. Representative kymographs and heatmaps for speed and radial velocity.
