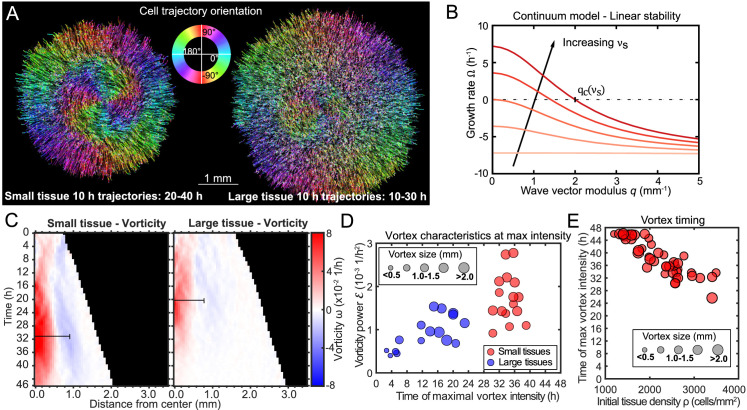
Figure 3. Vortex formation in expanding tissues.
(A) Vortical flows seen from 10 hr traces of cell trajectories in small (left) and large (right) tissues. We color each trajectory according to its local orientation. (B) Growth rate of perturbations of wave vector modulus q around the unpolarized state of the tissue bulk, Equation 3. Perturbations with wavelength longer than grow (), leading to large-scale spontaneous flows in the tissue bulk. We show curves for the following values of the polarity-velocity coupling parameter: mm−1. For the remaining parameters, we took Pa/μm, Pa⋅s/μm2, MPa⋅s, kPa⋅s, Pa, nN, as estimated in Pérez-González et al., 2019. (C) Average kymographs of vorticity show that the vortex in small tissues appears in the center and expands to >1 mm (n = 16), while vorticity in large tissues is present only during the early stages of tissue expansion (n = 16). The black bars indicate a characteristic vortex size. (D) Characteristic vortex size (marker size), time (horizontal axis), and intensity (vertical axis) of each tissue’s maximal vortex intensity. Small tissue vortices are generally more intense, with . (E) For small tissues, the time of maximal vortex intensity decreases with the initial cell density.


