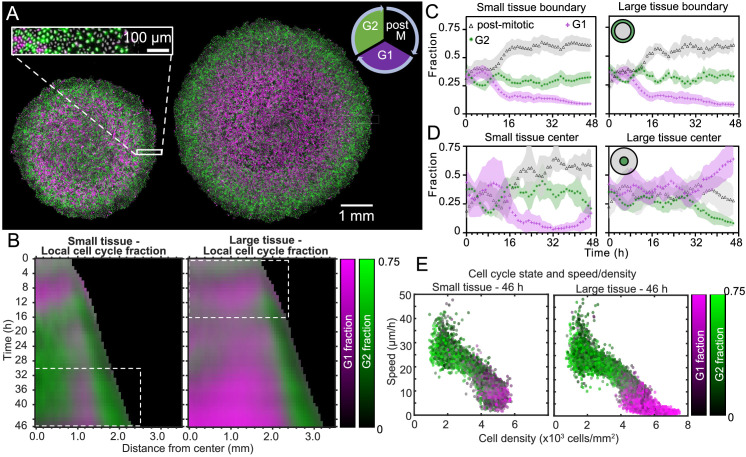
Figure 5. Coordinated spatiotemporal cell-cycle dynamics.
Transition from the G1 (magenta) to the G2 (green) phase of the cell cycle corresponds to DNA replication (during S phase). Subsequently, a cell proceeds to mitosis (M phase, dark), and eventually back to the G1 phase upon cell division. (A) Fluorescence images of the Fucci marker of cell-cycle state at the end of the experiment (46 hr) of representative small and large tissues overlaid with nuclei positions (gray). The boundary zone of both tissues has more cells in the G2 than in the G1 phase, along with a substantial proportion of dark cells (inset). Scale bars 1 mm. (B) Average kymographs (small, n = 5; large, n = 11) of cell-cycle-state fraction. In small tissues, a G1-dominated transition zone, which appears as a vertical magenta streak from 16 hr onward, is interposed between G2-dominated center and edge zones. While the size of small tissues from 30 to 46 hr matches that of large tissues from 0 to 16 hr (dashed boxes), cell-cycle states between these times are clearly distinct. (C) Fraction of cell-cycle states in the boundary zone. (D) Fraction of cell-cycle states in the center zone. Center and boundary zones are defined as in Figure 2. For C and D, n = 5 for small tissues and n = 11 for large tissues. (E) Scatter plot of density and speed, with color indicating the fraction of cells at G1 and G2, corresponding to each PIV pixel of the final timepoint of a representative small (left) and large (right) tissue.


