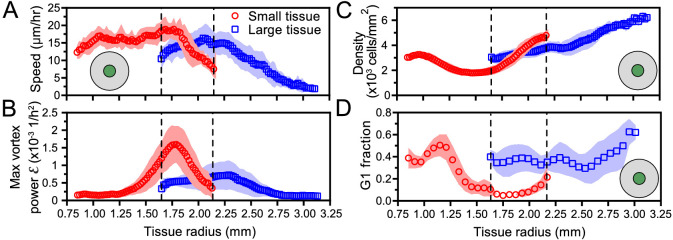
Figure 6. Initial tissue size, rather than current tissue size, determines the internal dynamics of expanding epithelia.
Here, we quantify the internal state of the tissue in terms of the cell speed in tissue center (A), maximal vortex power (B), cell density in tissue center (C), and fraction of cells in the G1 phase of the cell cycle in tissue center (D). At late times, initially-small tissues reach radii that initially-large tissues had at early times. When they have the same current size (overlap region in between dashed lines), initially-small and initially-large tissues have distinct internal dynamics of cell migration and cell proliferation. The tissue center zone in A, C, and D was defined as in Figure 2.

