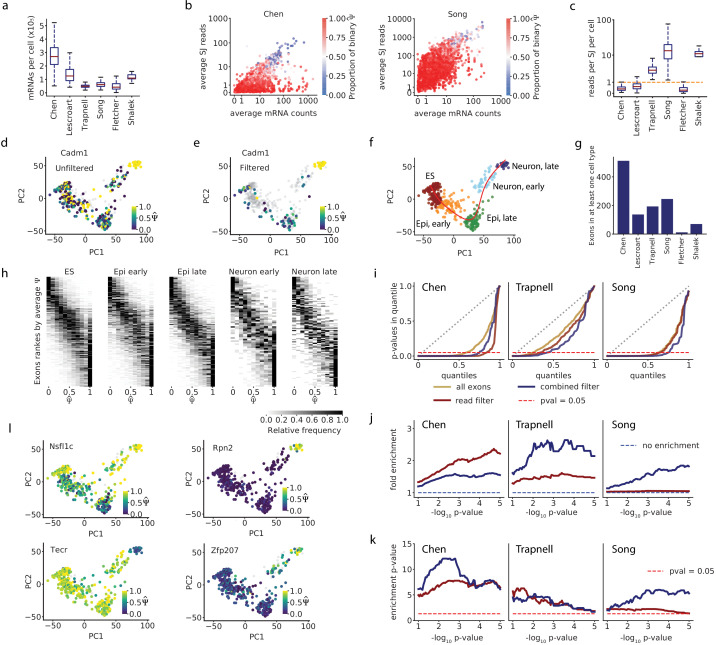
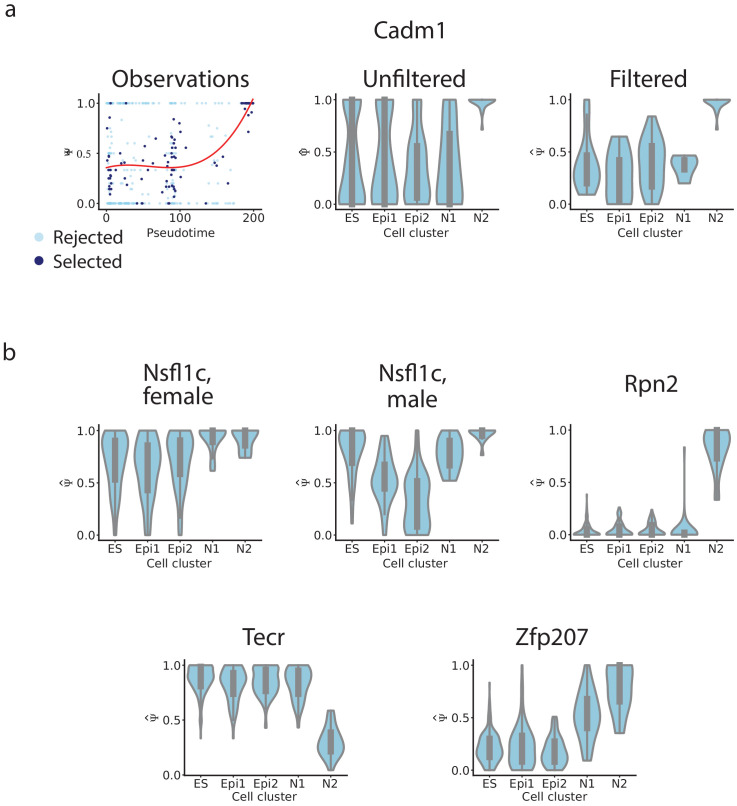
Figure 4. Accounting for coverage biases reveals unimodal splicing distributions and differential splicing.
(a) Estimated total mRNA molecules captured per cell. (b) Estimated number of recovered mRNAs vs splice junction reads for cassette exons, averaged across cells. Each dot corresponds to an exon, and its color indicates the proportion of cells in which it has a binary observation (only one isoform observed). We analyzed exons with average between 0.05 and 0.95. (c) Per-cell splice junction coverage rate in each dataset. (d) Cadm1 exon 8 alternative splicing appears binary in many cells in the Chen dataset. Correlation with lineage pseudotime: Spearman’s = 0.1. (e) Cadm1 exon after removing cells with fewer than 10 recovered Cadm1 mRNA molecules and fewer splice junction reads than expected from 10 mRNAs (grey). Spearman’s = 0.52. (f) PCA projection and clustering of single cells in the Chen dataset, showing differentiation of mouse ES cells into neurons. Red line, lineage inferred with Slingshot. (g) Number of cassette exons with observations from at least 10 mRNA reads in at least 50% of cells in any cluster. (h) Stacked histograms showing the distribution of observed of exons as in (g), in each cell cluster of the Chen dataset. Observations with fewer than 10 mRNA molecules were removed. We show exons with average ranging from 0.1 to 0.9 per cluster. (i) QQ-plot comparing the quantiles of a uniform distribution (x-axis) with the quantiles of the distributions of p-values from the Kruskal-Wallis test (y-axis). A diagonal line (gray dotted line) would mean the p-values are uniformly distributed. A lower area under the curve indicates enrichment for low p-values. The point on the x-axis at which each line crosses the dotted red line indicates the proportion of p-values that are below 0.05 in the distribution. (j) Fold enrichment of exons with a Kruskal-Wallis p < in the set of exons selected with the mRNA-based filter (blue), and exons selected with a flat read minimum filter (red). (k) Significance p-value of the enrichment, estimated with the hypergeometric test and adjusted for FDR. (l) Example exons that pass the overall filter criteria in the Chen dataset and have p<0.05 in the Kruskal-Wallis test.

