. 2020 Aug 18;14:1088. doi: 10.3332/ecancer.2020.1088

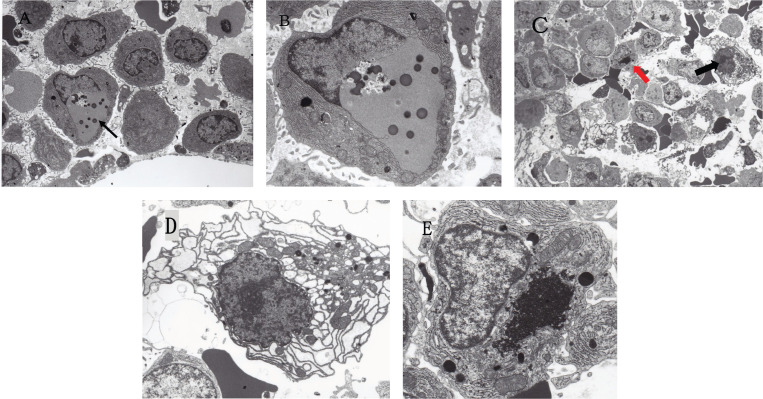
Figure 1. Electron micrographs of MM cells reflecting ER stress. (A) Low power view of the bone marrow (IgA-κ type MM) obtained before the initiation of chemotherapy. An arrow indicates a myeloma cell with an autophagosome. Original magnification ×2,000. (B) Enlarged view of a myeloma cell indicated by an arrow in (A) showing a well-developed autophagosome formed in perinuclear space. Several dense bodies (lysosomes) are scattered in the autophagosome. Original magnification ×5,000. (C) Low power view of the bone marrow (Bence Jones-λ type MM) obtained before the initiation of chemotherapy. A black arrow indicates a myeloma cell showing dilated RER, and a red arrow indicates a myeloma cell with aggresome. Original magnification ×1,000. (D) Enlarged view of a myeloma cell indicated by a black arrow in (C) showing remarkably dilated RER in the cytoplasm, suggesting RER-stress. Original magnification ×4,000. (E) Enlarged view of a myeloma cell indicated by a red arrow in (C) showing the well-developed aggresome formation in the cytoplasm. Original magnification ×4,000.

Figure 1.