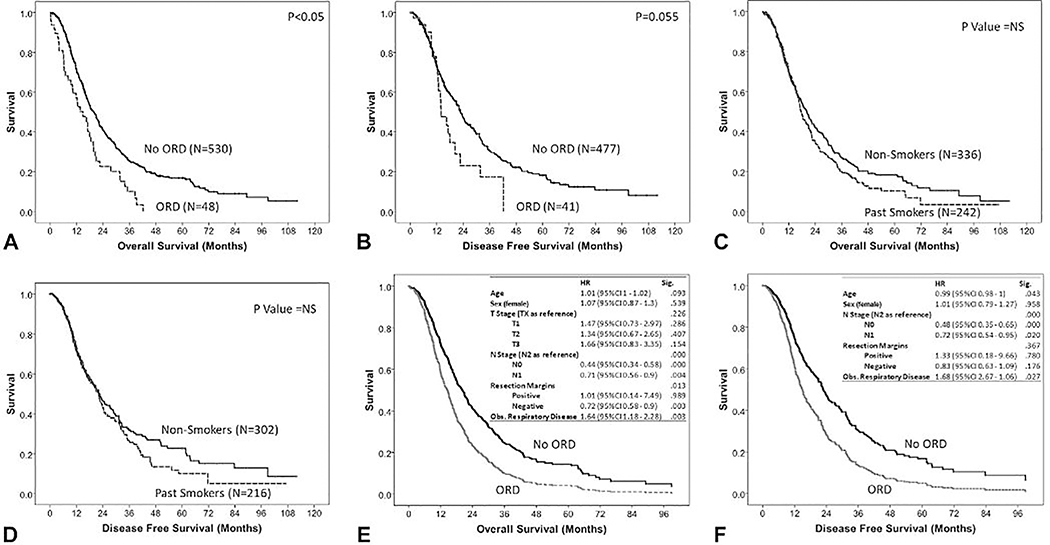
Figure 2.
Thomas Jefferson University cohort (N=578) survival analysis showing Kaplan-Meier plots comparing obstructive respiratory disorders (ORD) and non-ORD groups for (A) overall survival and (B) disease-free survival; Kaplan-Meier plots comparing smoking history groups for (C) overall survival and (D) disease-free survival; and Cox regression models for (E) overall survival and (F) disease-free survival. HR, hazard ratio; NS, not significant

