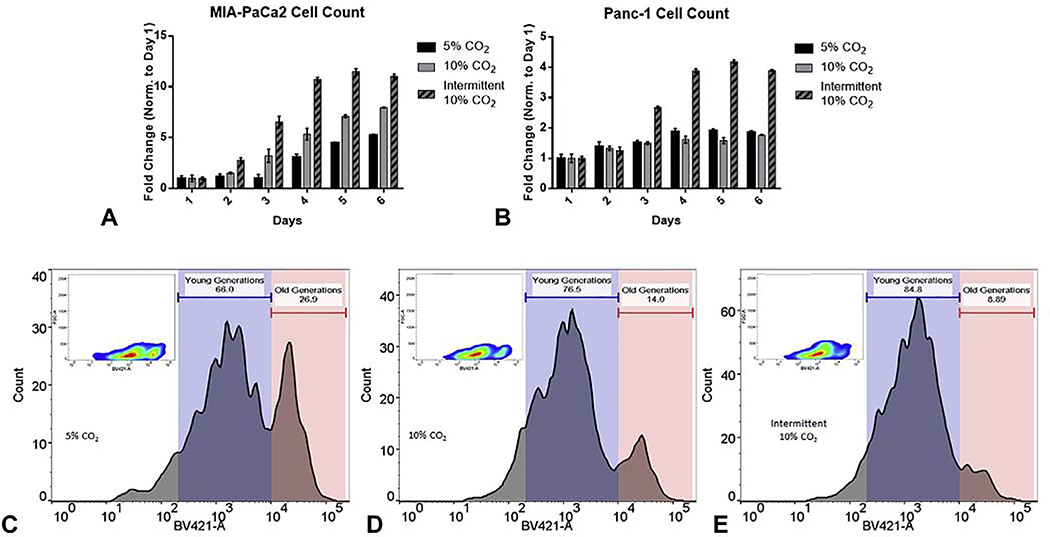
Figure 3.
Proliferation assays. daily quantification based on dsDNA measurement in (A) MIA-Paca2 and (B) Panc-1 pancreatic cancer cell lines exposed to intermittent or continuous 10% CO2 compared to control conditions of 5% CO2 (Mean ±SEM). (C-E) Flow cytometry of labeled MIA-Paca2 cells after long-term exposure to intermittent or continuous 10% CO2 compared to 5% CO2 controls (p<0.05)

