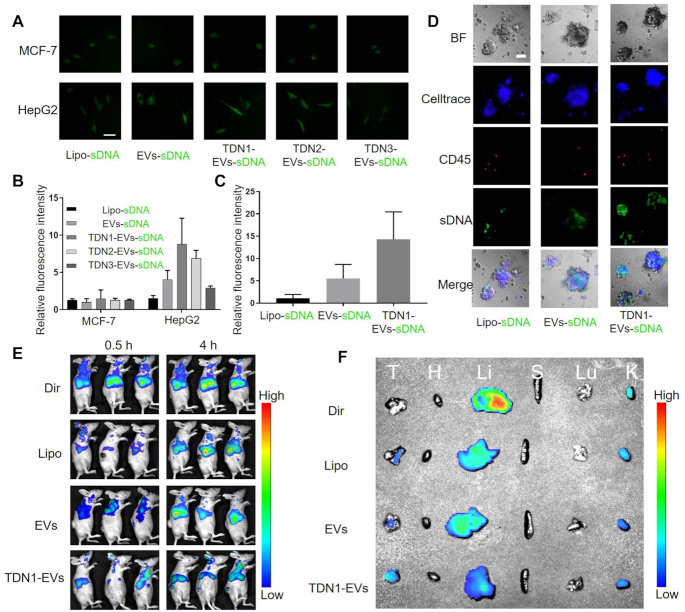
Figure 3.
Targeting effects of TDNx-EVs (x = 1–3) in vitro, ex vivo and in vivo. (A) Cellular uptake of indicated AF488-labelled sDNA loaded vehicles in HepG2 and MCF-7 cells, scale bar, 10 μm. (B) Quantification of intracellular fluorescence accumulation in HepG2 and MCF-7 cells over 8 h (n = 5). (C) Quantification of intracellular fluorescence accumulation in PLO models over 24 h. (D) Bright field, Celltrace blue, CD45-PE, sDNA-AF488 and merged pictures of the organoids exposing different nanoparticles (n = 3), scale bar, 50 μm. (E) Fluorescence images of HepG2 tumor-bearing mice treated with different foumlations at 0.5 and 4 h postinjection. (F) Biodistribution of fluorescent nanoparticles in major organs collected after 12 h of intravenous injection.

