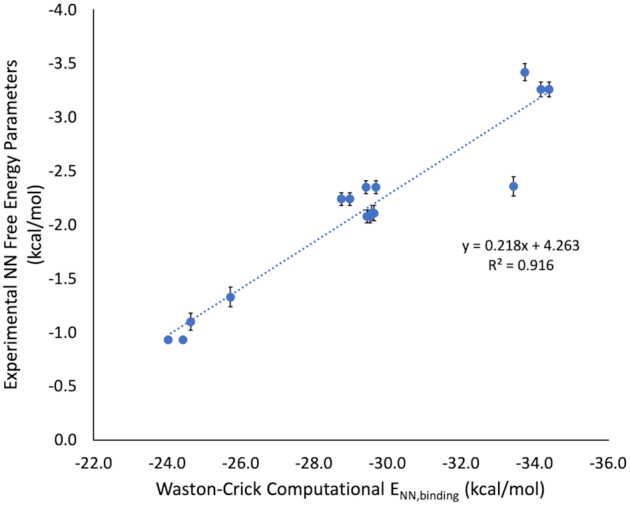
Figure 4.

Experimental NN free energy parameters for Watson–Crick nearest neighbor combinations versus computational NN binding energies (ωB97X-D3 with CPCM (water, α = 1.5 Å)) from NN geometries obtained from MD simulations. Average fiber diffraction data was used to benchmark QM methods as described in Supplementary Figure S2. However, because our method to obtain modified base pair NN geometries comes from MD simulations, it was necessary to run the same MD protocol on all A–U and G–C base pair NN combinations to ensure consistency in energy derivation. Therefore, eight A–U and eight G–C computational NN free energies (Supplementary Tables S5 and S6) were mapped to experimental NN free energy parameters (19) using a simple linear regression.
