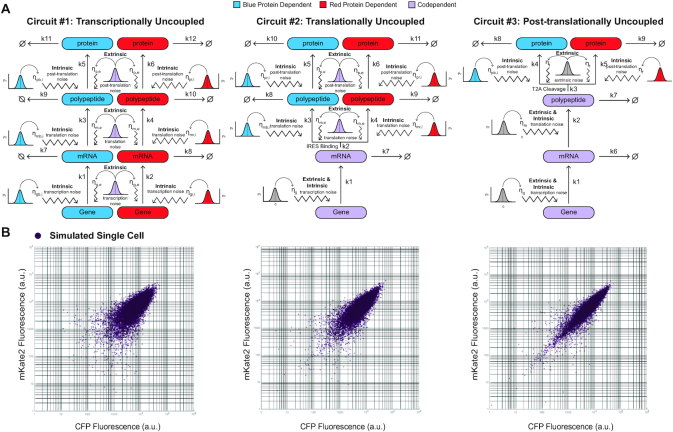
Figure 4.
Errors-in-variables (EIV) Modeling and simulation results. (A) Diagrammatic representation of error in variables ODE model of each synthetic architecture. Each random sampling of an error variable is indicated by a representative Gaussian distribution. The intrinsic noise sources at each production stage are sampled simultaneously, whereas the extrinsic noise sources are sampled once and applied to both noisy kinetic parameters within a given stage. The reaction species and sampling events that are solely responsible for the production of mKate2 or CFP are indicated in red and blue, respectively, whereas the reaction species and sampling events that are jointly responsible for the production of mKate2 and CFP are indicated in light purple. (B) Simulation results for the three architectures.

