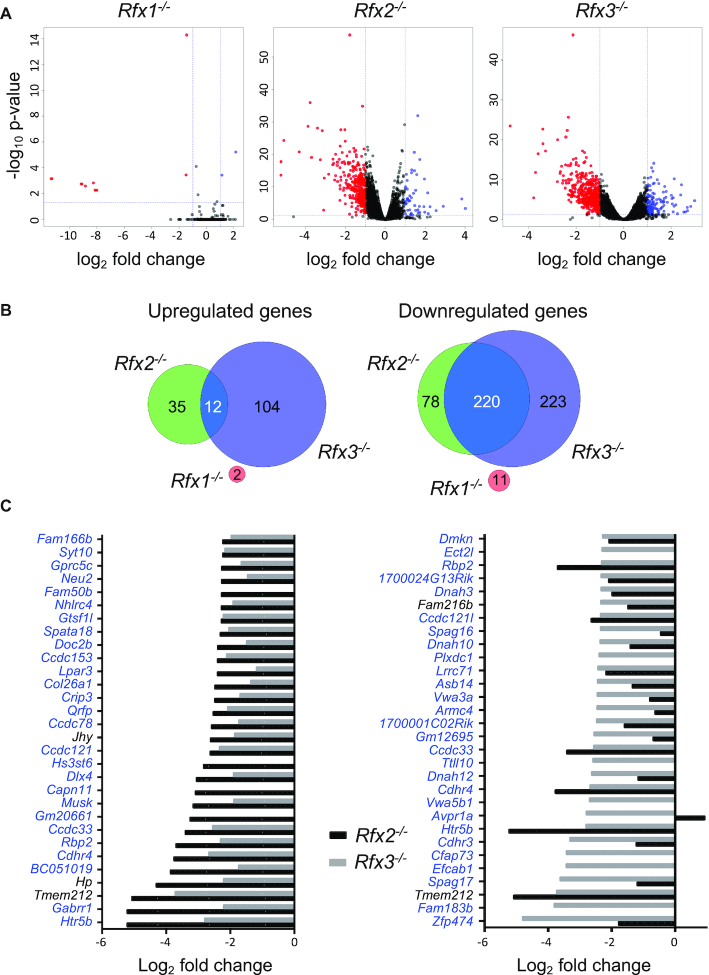
Figure 2.
Analysis of differentially expressed genes in ependymal cells from Rfx1, Rfx2 or Rfx3 deficient mice. (A) The volcano plots represent statistical significance (Y-axis, –log10P-value) and fold change (X-axis, log2 fold change) for alterations in gene expression observed in Rfx1−/−, Rfx2−/− or Rfx3−/− cells relative to WT cells. Whereas only few genes exhibited significantly altered expression in Rfx1−/− cells, numerous genes were differentially expressed in Rfx2−/− and Rfx3−/− cells. (B) The Venn diagrams summarize the overlaps observed between up (left) or down (right) regulated gene sets (fold change >2) in Rfx1−/−, Rfx2−/− or Rfx3−/− cells. Whereas there is little overlap between genes upregulated in Rfx2−/− and Rfx3−/− cells (left), most genes downregulated in Rfx2−/− cells are also downregulated in Rfx3−/− cells (right). There is no overlap between genes that are differentially expressed in Rfx1−/− cells and Rfx2−/− or Rfx3−/− cells. (C) The bar graphs show the fold changes in gene expression (log2 fold change) observed in Rfx2−/− (black bars) and Rfx3−/− (grey bars) cells for the 30 genes that are downregulated most strongly in Rfx2−/− (left) or Rfx3−/− (right) ependymal cells. Whereas nearly all genes that are strongly downregulated in Rfx2−/− cells are also strongly downregulated in Rfx3−/− cells (left), the reverse is not true (right). Genes highlighted in blue contain at least one X-box motif in their promoter region (−1000 to +500 bp).

