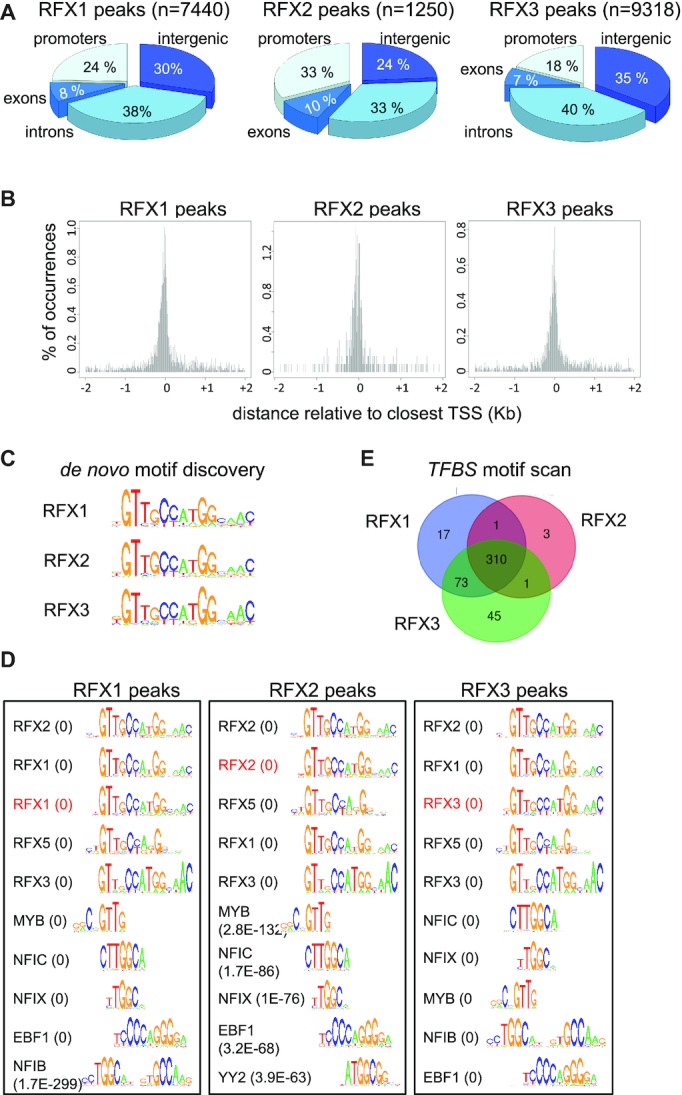
Figure 4.

Identification of direct target genes and binding motifs for RFX1, RFX2 and RFX3. ChIP-seq was used to map genomic sites occupied by RFX1, RFX2 and RFX3 in mouse ependymal cells. (A) The pie charts illustrate the distribution of sites occupied by RFX1, RFX2 and RFX3 in the indicated portions of the genome. (B) The histograms represent the spatial distribution of RFX1, RFX2 and RFX3 occupied sites within promoter-proximal regions (−2kb to +2kb) centered on annotated TSSs. (C) The sequences logos show the top scoring DNA motifs identified by de novo motif discovery analysis (cosmo package) performed with the 100 most robust RFX1, RFX2 or RFX3 ChIP-seq peaks. All three motifs perfectly match the X-box motifs described in Figure 3B. (D) Sequence logos are shown for most enriched TFBS motifs identified using Pscan in ChIP-seq peaks for RFX1, RFX2 or RFX3. Only the 5 top ranking RFX motifs and non-RFX motifs are represented. The scan was done with all TFBS motifs from the JASPAR database. The de novo motifs (red) identified in (C) were included in the scan and are among the five best motifs. P-values are indicated in parentheses: values <1.0E–300 were rounded off to 0. The full list of motifs and P-values for their enrichment are provided in Supplementary Table S5. (E) The Venn diagrams show the overlap between sets of DNA motifs, distinct from the X-box, identified in regions bound by RFX1, RFX2 or RFX3 (see Supplementary Table S5). Certain motifs appear to be specifically enriched in RFX1 (17 motifs) or RFX3 (47 motifs) occupied regions. A significant number of other motifs are found in regions bound by both RFX1 and RFX3 (73 motifs) or by all three RFX factors (310 motifs).
