
Figure 1.
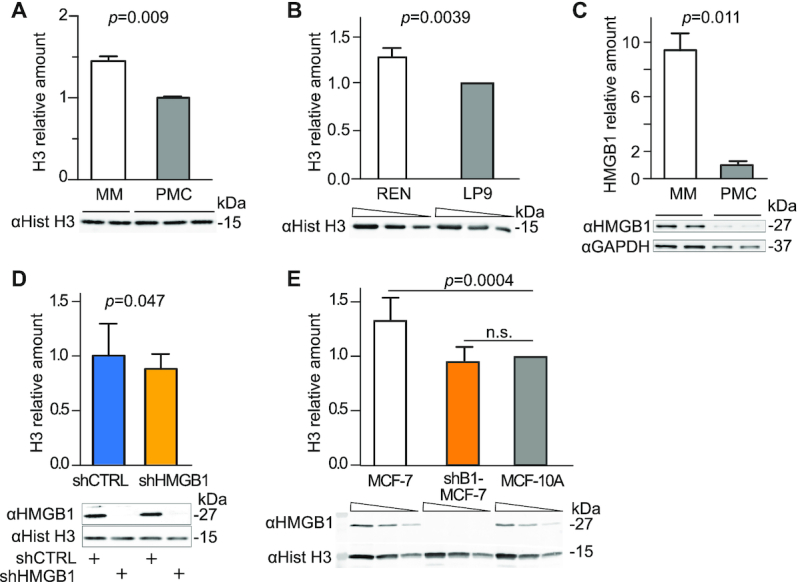
Malignant Mesothelioma cells have a high histone content that can be partially reverted by HMGB1 downmodulation. (A) Histone H3 levels in whole cell lysates of malignant mesothelioma (MM) cells and Primary Mesothelial Cells (PMC) were assessed by quantitative Western blotting. The intensity of Coomassie staining was used as loading control and normalization (Supplementary Figure S1E). Bars and error bars represent average and standard deviation, respectively (biological replicates are shown). Statistics: unpaired t-test. This experiment was repeated twice with comparable results. (B) Histone H3 levels in REN human mesothelioma cell line and its non-tumoral counterpart, human mesothelial cell line LP9. The relative amount of H3 histone in REN cell relative to LP9 cells (normalized to 1) was tested in two different experiments. Below the plot, a representative western blot is shown in which three sequential 1:2 dilutions for each sample are loaded (wedges). Bars and error bars represent average fold-change and standard deviation. Statistics: one-sample t-test. (C) HMGB1 is highly expressed in MM cells as compared to PMC. Total cell lysates were analysed by quantitative Western blot; HMGB1 level after normalization to GAPDH levels is shown. Bars and error bars represent average and standard deviation, respectively (n = 2; biological replicates). Statistics: unpaired t-test. This experiment was repeated twice with comparable results. (D) Histone H3 levels are lower in MM cells when HMGB1 is downregulated by a targeted shRNA (shHMGB1). shHMGB1 and shCTRL cell extracts are compared by quantitative western blot. H3 bands are quantified and normalized with the Coomassie staining (Supplementary Figure S1F). Mean and standard deviation of H3 levels are shown (n = 7 biological replicates in independent experiments). Statistics: one-sample t test with a hypothetical mean = 1. (E) Histone H3 levels in whole cell lysates of human breast cancer MCF-7, MCF-7 knocked-down for HMGB1 (shB1/MCF-7) and mammary epithelium MCF-10A cells (set to 1). Quantification as in panel B. Statistics: one-sample t test (n = 4 independent experiments). MCF-7 cells and shB1-MCF-7 cells are statistically different (P = 0.0022 unpaired t test); n.s. = not significant.