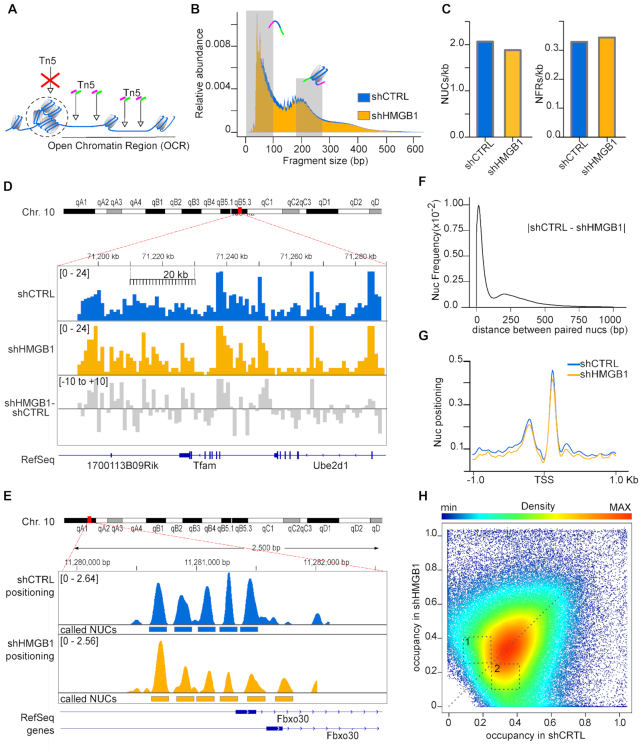
Figure 2.
HMGB1 knock-down MM cells have fewer nucleosomes and lower nucleosome occupancy genomewide. (A) Summary of ATAC-seq protocol. Open Chromatin regions (OCRs) correspond to regions with a high frequency of transposition events. (B) Fragment size distribution of ATAC-seq libraries obtained from shCTRL and shHMGB1 MM cells. Shaded areas (0–100 and 186–282 bp) indicate the sizes of the ATAC-seq fragments corresponding to NFRs and mononucleosomes. (C) NUCs and NFRs called by NucleoATAC, normalized for the number of base pairs belonging to OCRs in both cell lines. (D) Distribution of mononucleosome reads normalized by library size on a section of chromosome 10 (bins of 1 kb, scalebar) in shCTRL (blue) and shHMGB1 (yellow) MM cells. The gray track represents the difference between yellow and blue tracks. (E) Positioning of nucleosomes on 3 kb around the promoter of the Fbxo30 gene in shCTRL (blue) and shHMGB1 (yellow) MM cells. Rectangles mark the positions of the called nucleosomes. (F) Comparison of genomewide nucleosome positioning. Frequency distribution of the distance (in either direction) between the dyad axes of paired nucleosomes in shCTRL and shHMGB1 MM cells. The mode of the distribution is 16 bp. (G) Nucleosome positioning around TSS of all genes; the mean cross-correlation signal is centred at the TSS. (H) Scatter density plot of nucleosome occupancy score in shCTRL (x axis) and shHMGB1 (y axis) cells, as calculated by NucleoATAC tool. Each point is colored by its estimated local density (scalebar). A dashed line for perfect linear relationship (x = y) is indicated. Dashed numbered boxes are drawn to help visualization of differences between shCTRL and shHMGB1 nucleosome occupancy.

