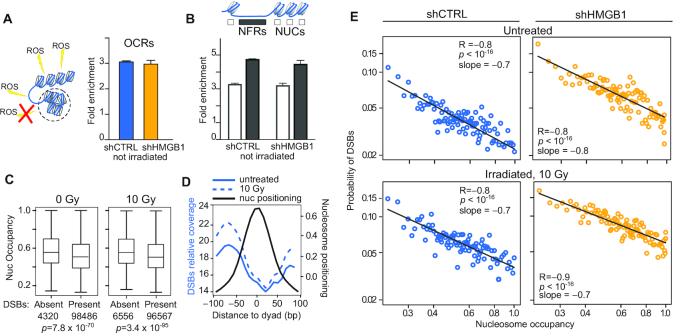
Figure 4.
Nucleosomes shield DNA from DSBs. (A) DSBs are preferentially associated to OCRs. The fold enrichment of DSBs falling in OCRs relative to the entire genome is plotted here as mean and standard deviation of two replicates per experimental condition. The difference between the observed enrichment and the enrichment in a null distribution of randomly generated genomic sequences equal in size and number to the observed OCRs is statistically significant (P = 0.001; statistics described in Materials and Methods and shown in Supplementary Figure S4A). Not irradiated shCTRL and shHMGB1 MM cells are shown as representative result; the same results hold true for all BLISS samples (Supplementary Figure S4A). (B) DSBs are enriched in NFRs. The fold enrichment relative to the entire genome is calculated as in (A) considering separately NUCs or NFRs in OCRs. Statistics: P = 0.001, calculated as in panel A and shown in Supplementary Figure S4B,C. (C) Nucleosomes damaged by a DSB have lower occupancy. The distribution of occupancy values is shown for intact nucleosomes and DSB-containing nucleosomes in two representative samples (shCTRL-MM cells irradiated or not with 10 Gy). Boxes and whiskers correspond to 25–75 and 5–95 percentiles, respectively; horizontal line is the median. Statistics, Mann-Whitney test. (D) DSBs accumulate far from the nucleosome dyad axis. DSB relative coverage (left y-axis, reads per genome coverage) on metadata profiles centred on nucleosome dyads (black line; right y-axis: cross-correlation normalized signal from NucleoATAC). Blue lines represent DSB coverage averaged on the two replicates of unirradiated (fill) and 10 Gy irradiated (dashed) shCTRL cells. (E) The probability of harboring DSBs decreases as nucleosome occupancy increases. Each dot represents one percentile in nucleosome occupancy. The x-axis, log scale, is the nucleosome occupancy value; the y-axis, log scale, is the probability to harbor one or more DSBs. The linearity in the log-log plot indicates a power distribution. Statistics: Pearson correlation on the log-transformed values. This result holds true for all the other BLISS samples (Supplementary Figure S4D).

