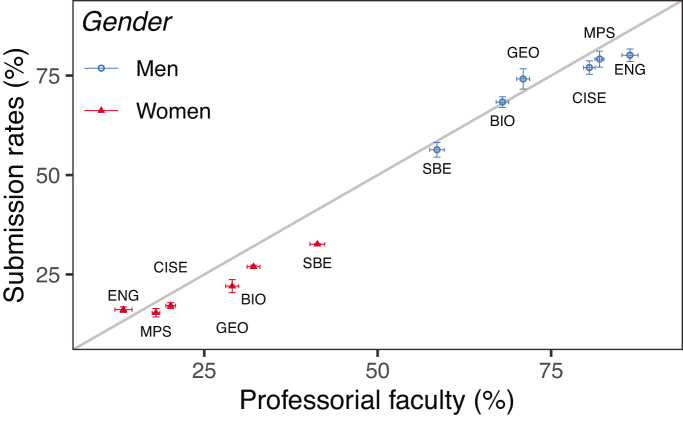
Figure 2.
Relationship between grant submission rates (y-axis) and the percentage of professorial faculty (i.e., assistant, associate, and full professors; x-axis) for women (triangles) and men (circles) associated with each NSF directorate. Data on submission rates collected from NSF's merit review report (NSF 2016) and professorial faculty numbers from data S1. Each point represents the mean value, and the error bars represent the standard error, over three recent years: 2008, 2010, and 2013. (2015 data were not included because the Survey of Doctorate Recipients was redesigned that year.) The gray line represents a 1:1 ratio between submission rates and the percentage of professors in academic positions. The NSF directorates include social, behavioral and economic sciences (SBE); biological sciences (BIO); geosciences (GEO); computer and information science and engineering (CISE); engineering (ENG); and mathematical and physical sciences (MPS).

