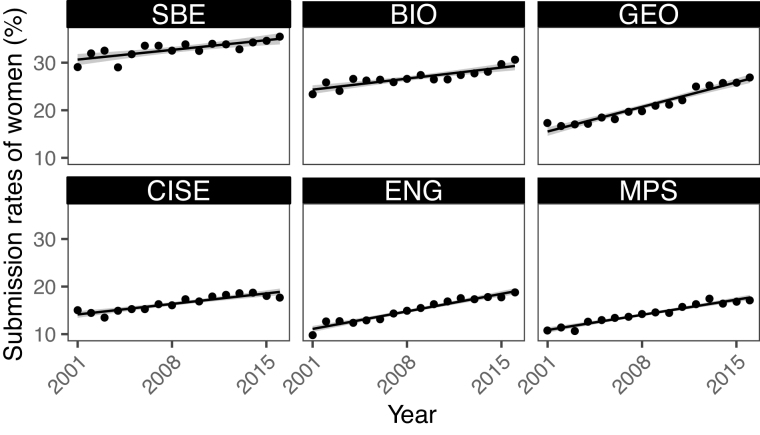
Figure 3.
Submission rates of women across directorates at the National Science Foundation. Submission rates of women by year (2001–2016) for each directorate including social, behavioral and economic sciences (SBE); biological sciences (BIO); geosciences (GEO); computer and information science and engineering (CISE); engineering (ENG); and mathematical and physical sciences (MPS). Solid lines represent linear relationships with 95% confidence intervals (gray shaded area) and points represent each year.

