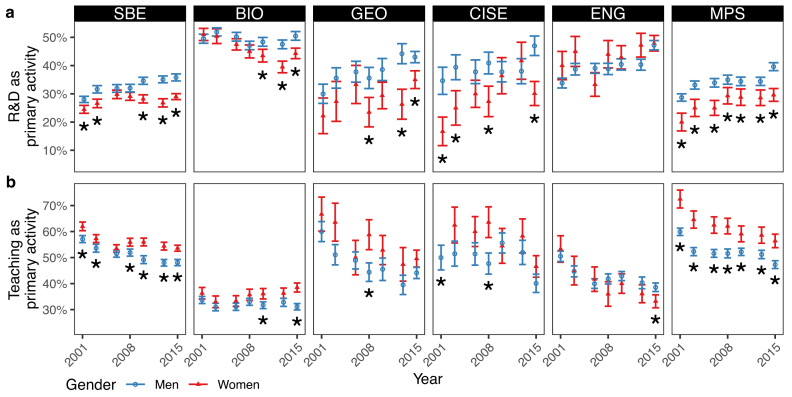
Figure 4.
Differences between the proportion of men (blue circles) and women (red triangles) who report their primary work activity in a typical week according to the Survey of Doctorate Recipients from 2001 to 2015. (a) The percentages of each gender who report research as their primary work activity. (b) The percentages of each gender who report teaching as their primary work activity. Primary work activity is derived from SDR question A31: “On which two activities in question A30 did you work the most hours during a typical week on this job?” Question A30 presents a selection of 14 work activities. Respondents are asked to indicate which work activities “occupied at least 10 percent of your time during a typical work week on this job.” SDR estimates are based on a sample of the population and may differ from actual values because of sampling variability or other factors. As a result, apparent differences between the estimates for two or more groups may not be statistically significant. Statistically significant comparisons between the genders in a given year, determined by z-tests, are at the 90% confidence interval and marked with an asterisk (∗). The value for CISE women in 2001 (4b) is 83% but not reported in order to keep the scale bar at a level where the differences are clear for all NSF directorates. The NSF directorates are listed from left to right in order of those with more women to those with fewer women and include social, behavioral and economic sciences (SBE); biological sciences (BIO); geosciences (GEO); computer and information science and engineering (CISE); engineering (ENG); and mathematical and physical sciences (MPS).

