Figure 5.
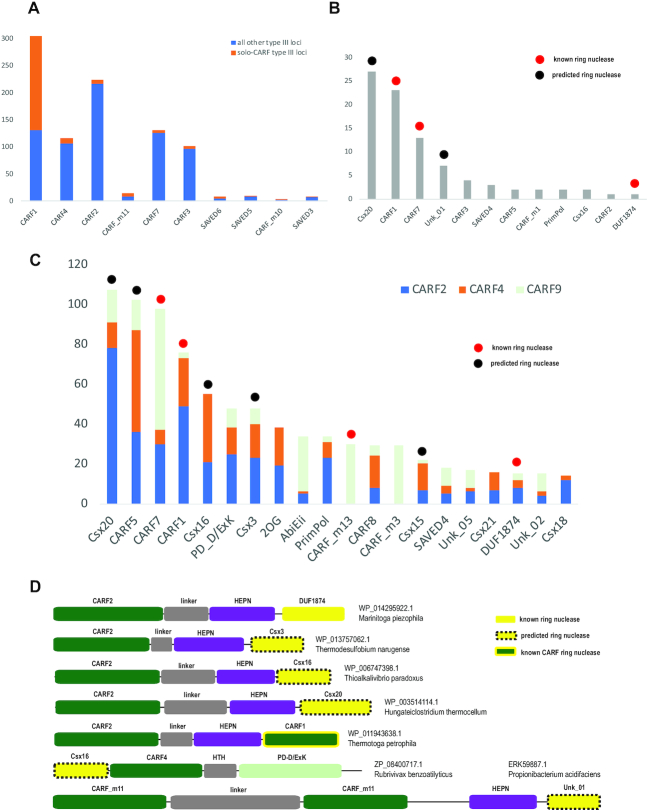
Analysis of the components of the cOA signaling pathway (A) Representation of different CARF groups in type III CRISPR-cas loci. Vertical axis, number of type III loci that encode the where respective CARF. Orange bars show the loci with a single CARF domain containing gene with additional requirement that no previously reported type III associated non-CARF genes (1) or CARF proteins from other groups are present in the respective genome (solo-CARF loci). Blue bars show the remaining loci. (B) Co-occurrence of different families of CARFs and type III associated proteins in the genome encoding only one such protein, in addition to CARF2, CARF4 or CARF9 (‘double’ CARF loci). The vertical axis is the number of ‘double’ CARF loci. (C) Co-occurrence of different families of CARFs and type III associated genes with three major groups of CARFs predicted to lack ring nuclease activity (CARF2, CARF4 and CARF9). The vertical axis is the number of CARF loci. (D) Domain organizations of selected proteins containing known or predicted ring nuclease domains. The domains are shown approximately to scale. The domain family name is indicated above each bar.

