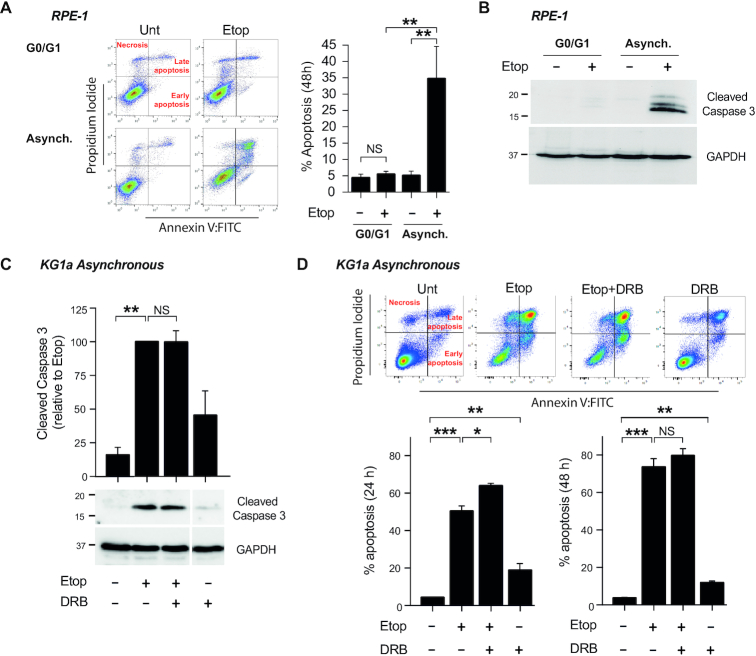
Figure 3.
DSB-induced apoptosis by etoposide is independent of transcription. (A) Apoptosis analysis by FACS of G0/G1 and asynchronous RPE-1 cells treated with 100 μM etoposide for 11 h. Following treatment cells were cultured in drug-free medium for 48 h. Left, Representative dot-plots (Annexin-V vs. Propidium Iodide). Right, Mean (± s.e.m.) of the percentage of Annexin-V positive cells. Statistical significance was determined by t-test of three independent experiments (**P< 0.01, NS, not significant). (B) Protein blots of cleaved Caspase-3 in RPE-1 cells treated as in (A). GADPH was used as a loading control. Molecular weight markers are in kDa. (C) Protein blots of cleaved Caspase-3 in cycling KG1a cells treated with 40 μM etoposide for 3 h. Where indicated, pre-incubation with DRB (100 μM) for 1 h prior to etoposide treatment. After treatment, cells were cultured in drug-free medium for 24 h. Bottom, representative images. Molecular weight markers are in kDa. Top, quantification (mean ± s.e.m.) of three independent experiments. Caspase-3 protein levels were normalized with respect to GAPDH. Statistical significance was determined by t-test (**P< 0.01, NS, not significant). (D) Apoptosis analysis of cycling KG1a cells by FACS. Cells were treated as in (C). Cells were incubated in drug-free medium for 24 and 48 h. Top, representative dot-plots (Annexin-V versus Propidium Iodide) at 24 h. Bottom, Percentage of Annexin-V positive cells (mean ± s.e.m.) of three independent experiments at 24 and 48 h. Statistical significance was determined by t-test (*P< 0.05, **P< 0.01, ***P< 0.001, NS, not significant).

