Figure 5.
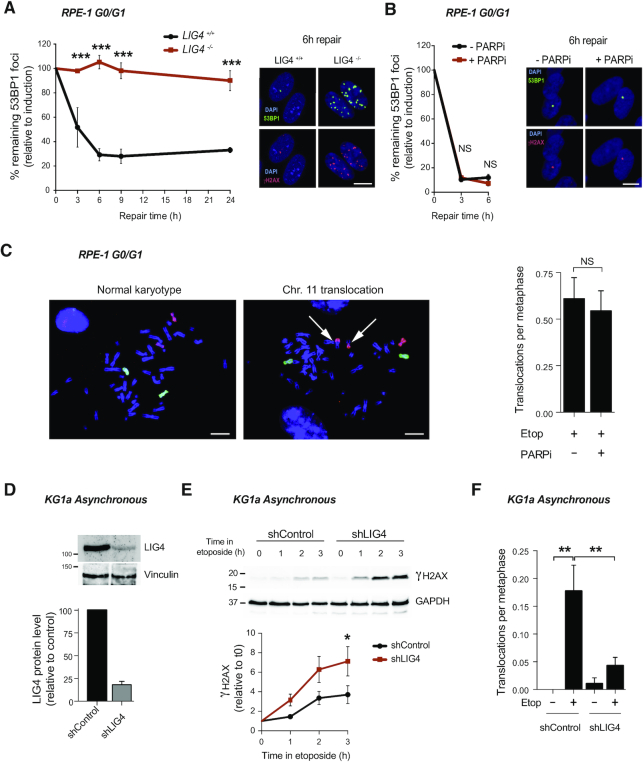
cNHEJ pathway repairs TOP2-induced DSBs. (A) 53BP1 foci in serum-starved wild-type (LIG4+/+) and LIG4−/− RPE-1 cells after 30 min treatment with 10 μM etoposide, and after the indicated repair periods in drug-free medium. Values are shown as percentage of remaining foci after induction (0 h of repair). Representative images of 53BP1 foci (green), γH2AX foci (red) and DAPI counterstain (blue) for the 6 h repair time point are shown. Scale bar, 10 μm. Data are the mean (± s.e.m.) of three independent experiments. Statistical significance was determined by two-way ANOVA (***P< 0.001, NS, not significant). (B) 53BP1 foci in serum-starved RPE-1 cells before and 30 min after treatment with 10 μM etoposide, and after the indicated repair periods in etoposide-free medium. Where indicated, cells were pre-incubated with the PARP inhibitor KU58948 (1 μM) for 1h prior to etoposide treatment and during repair. Other details as in (A). (C) Translocation frequencies (translocations per metaphase) in chromosome 8 and 11 were quantified in serum-starved (G1/G0) RPE-1 cells in metaphase spreads prepared 48 h after etoposide treatment (1 h, 50 μM). Where indicated, cells were pre-treated with PARP inhibitor (1 μM) for 1 h prior to, during, and 4 h after etoposide treatment. Data are the mean (± s.e.m.) of two independent experiments. (D) Analysis of LIG4 protein level after the generation of a KG1a knockdown cell line by stably expression of shRNA against LIG4 (shRNA LIG4). Top, representative protein blots. Molecular weight markers are in kDa. Bottom, quantification of two independent experiments (mean ± s.e.m.). LIG4 signal normalized with respect to Vinculin. LIG4 protein relative to the control cells (shRNA control). (E) Accumulation of γH2AX in shRNA LIG4 and control cells after 20 μM etoposide for indicated time. Top, proteins blots. Bottom, quantification (mean ± s.e.m.) of three independent experiments. γH2AX protein level was normalized with respect to GAPDH. Molecular weight markers are in kDa. Data are the mean (± s.e.m) of three independent experiments. Statistical significance was determined by t-test at indicated time (*P< 0.05) (F) Translocation frequencies (translocations per metaphase) in chromosome 8 were quantified in KG1a shRNA LIG4 and control cells metaphase spreads prepared 12 h after 20 μM etoposide (3 h) treatment by chromosome 8 FISH. Data (mean ± s.e.m.) of four independent experiments are shown. Statistical significance was determined by t-test (**P< 0.01).

