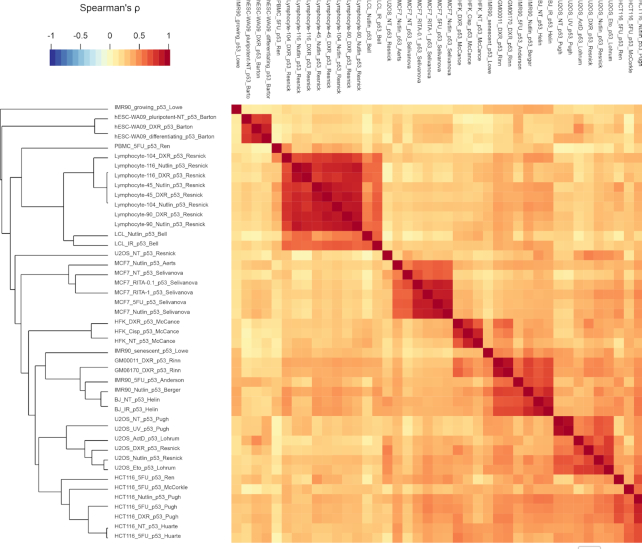
Figure 5.
Hierarchical clustering of read coverage signal across p53 peaks that appear in ≥20 datasets was performed considering the Spearman correlation. Clustering results are displayed in a heatmap; the color of individual cells describes the correlation value between two datasets and the cluster distances between each sample shown using a dendrogram. Data from (6).

