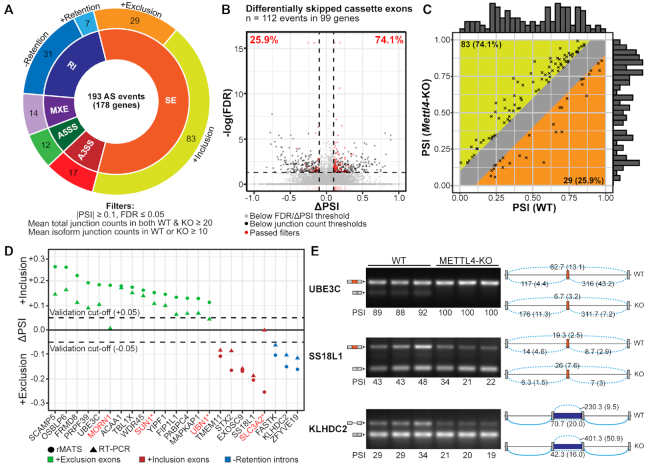
Figure 4.
Summary of splicing changes upon Mettl4-KO. (A) Breakdown of the 193 differential alternative splicing events between wild-type and Mettl4-KO HEK293T, as reported by rMATS (Supplementary Table S3), and with the indicated cutoffs. SE, skipped or cassette exon; A5SS, alternative 5′ splice sites; A3SS, alternative 3′ splice sites; MXE, mutually exclusive exons; RI, retention of introns. (B) Volcano plot of differentially spliced cassette exons, with events that passed the filters denoted as red dots. Dashed horizontal and vertical lines respectively depict the cutoffs in significance (FDR) and magnitude of splicing change (ΔPSI). (C) Plot of initial PSI (WT) against final PSI (Mettl4-KO). The marginal histograms represent the relative distribution of initial and final PSI values. (D) Plot of the ΔPSI values reported by rMATS and the corresponding RT-PCR assays for 20 cassette exons and three introns. Red gene names indicate splicing events that were not validated. Asterisks indicate events that were discretionally unvalidated based on high between-sample variations or inability to resolve one of the isoforms. (E) RT-PCR validations of two differential alternative splicing events for cassette exons in the UBE3C and SS18L1 genes, as well as an intron retention event in KLHDC2, in three biological replicates per WT or KO. The identity of splicing products by exon inclusion or exclusion is schematically shown next to the gels, along with mean junction reads (standard deviation within parentheses) across WT or KO samples. The PSI values obtained via RT-PCR are expressed in PSI values multiplied by 100.

